Most MSP founders treat Customer Journey Mapping (CJM) as a diagram for the marketing shelf. This mistake stalls growth, causing revenue leakage when Sales, Service, and Marketing optimize in isolation. A strategic b2b customer journey mapping model is a revenue operations control surface. It links every touchpoint to measurable financial outcomes: Qualified Leads, expansion revenue, reduced churn, and better gross margin. The resulting map ensures your PSA/CRM data aligns directly with board-level mandates: CLV, sales cycle velocity, and compliance readiness. We start by establishing the core journey spine.
1. Define the Core MSP Journey Spine
The biggest barrier to effective B2B customer journey mapping is the “blank sheet syndrome.” Teams waste time debating touchpoints before agreeing on major phases. If Sales and Service cannot align on the precise moment a prospect moves from ‘Consideration’ to ‘Decision,’ automation and measurement fail. A minimum viable journey spine—six non-negotiable stages—solves this by defining the MSP lifecycle from initial need to long-term value. , as outlined in our comprehensive MSP marketing playbook.
This structure forces necessary strategic alignment, especially regarding the crucial expansion and exit phase:
The Six Stages of MSP Revenue Flow
- Sensibilisierung: Prospect recognizes a specific organizational problem (e.g., security incident, compliance deadline, IT outgrown).
- Erwägung: Determining the path to resolution (Outsourcing vs. In-house; MSP vs. MSSP).
- Decision/Contract: Proposal review, risk assessment, references, and the signing of the MSA/SOW.
- Onboarding: The formal handoff from Sales to Service, discovery, and standardization.
- Delivery: Ongoing service execution (tickets, projects, vCIO alignment, Quarterly Business Reviews/QBRs).
- Renewal/Exit: Strategic relationship review, re-scoping, competitive replacement mitigation, or formal termination.
The crucial discipline is defining the Entry and Exit Criteria for each phase. This critical one-page artifact prevents internal friction by establishing the exact trigger that confirms a move (e.g., out of Delivery, into Renewal). This rigorous structure is the exact pattern used in sophisticated revenue attribution programs that drive predictable growth. Always model inevitable exit paths (drop-off reasons)—no budget, wrong fit, compliance objection—at every stage, ensuring sales accounts for non-linear behavior. This focus shifts improvement efforts from mapping touchpoints to managing velocity and increasing customer lifetime value (CLV).
2. Multi-Thread the Sale: Mapping the B2B Buying Committee
The single greatest failure point in MSP revenue cycles is relying on a “champion-only” strategy. Deals collapse late—usually at procurement, legal, or the CFO’s desk—because the specific concerns of the buying committee were never addressed. Mapping only the user’s journey ignores the internal financial and political landscape that dictates contract approval.
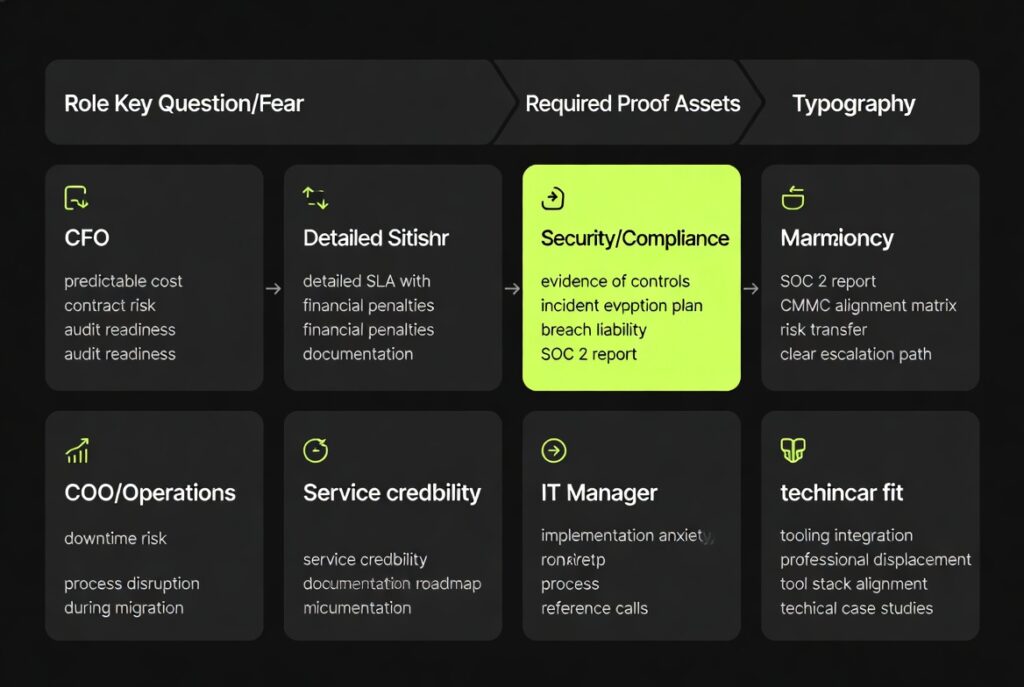
Effective B2B customer journey mapping must synchronize the needs of 4–6 key roles simultaneously. This multi-threaded sales motion ensures that required evidence is deployed in parallel, neutralizing common late-stage deal-killers:
| Rolle | Key Question/Fear | Required Proof Assets |
|---|---|---|
| CFO | Predictable cost, contract risk, audit readiness. | Detailed SLA with financial penalties, risk transfer documentation. |
| Security/Compliance | Evidence of controls, incident response plan, breach liability. | SOC 2 report, CMMC alignment matrix, clear escalation path. |
| COO/Operations | Downtime risk, process disruption during migration, service credibility. | Implementation roadmap, process documentation, reference calls. |
| IT Manager | Technical fit, tooling integration, professional displacement anxiety. | Tool stack alignment, migration plan, technical case studies. |
To accelerate velocity, deploy role-specific messaging aligned to their journey stage. The CFO in the ‘Awareness’ stage cares about high-level cost predictability, but in the ‘Decision’ stage, they require explicit contract language regarding liability and risk transfer.
A lead is not truly ‘Qualified’ until you define a CFO-qualified signal (cost model acceptance) and an IT-qualified signal (technical alignment). By proactively providing required proof for all stakeholders, you manage complexity and prevent vague SLAs or weak compliance posture from becoming catastrophic deal-killers, driving predictable MSP revenue growth.
3. Instrument Your Data: Unifying PSA, CRM, and Compliance Touchpoints
The primary obstacle to effective b2b customer journey mapping is siloed reporting: marketing reports ‘leads,’ sales reports ‘calls,’ and service reports ‘tickets’—with zero shared attribution or lifecycle visibility. This fragmentation prevents accurate Customer Lifetime Value (CLV) calculation and erodes the integrity of your overall strategy.
The solution requires establishing a minimum instrumentation layer using the Professional Services Automation (PSA) and CRM tools you already run. This layer unifies operational reality (service delivery) with strategic context (pipeline). This layer unifies operational reality (service delivery) with strategic context (pipeline). To achieve this, many firms utilize HubSpot for MSPs to define the mandatory fields each system must contribute to a single, master Journey Event Schema.
The Minimum Instrumentation Layer
- PSA (ConnectWise/Autotask): Tracks Service Delivery touchpoints: tickets, project phases (e.g., discovery complete), onboarding tasks, and SLA events.
- CRM: Standardizes strategic touchpoints: opportunity stages, primary contact roles (representing the buying committee), and mandatory lost reasons oder no decision categories.
- Web Analytics: Ties content consumption (e.g., whitepaper download) directly to the contact record, linking engagement to a specific journey stage (Awareness or Consideration).
Enforcing Data Quality and Compliance
To avoid garbage data, enforce strict logging rules. Every opportunity touchpoint requires a stage, a primary role, and an identifiable trigger event (e.g., compliance deadline, critical incident, leadership change).
Crucially, anchor operational data to compliance realities. Treat evidence requests for SOC 2 or CMMC security questionnaires not as overhead, but as mandatory, measurable journey touchpoints within a broader compliance marketing strategy. For cybersecurity-focused MSPs or MSSPs, building topical authority through targeted content and backlinks can significantly amplify visibility during Consideration and Decision stages — as demonstrated in the Microminder cybersecurity growth case study.
The final output is a single Journey Event Schema (a simple list of required fields and definitions). This schema directly links technical onboarding milestones (kickoff date, tool rollout, first QBR) into the financial system, turning service execution into measurable revenue velocity.
4. Inventory Trust Points: Mapping Delivery and Service Touchpoints
Focusing b2b customer journey mapping solely on acquisition leaves the map strategically incomplete. Customer Lifetime Value (CLV) is primarily built or destroyed during Delivery and Renewal; these service touchpoints, not marketing collateral, drive the long-term expansion pipeline. To operationalize this view and prevent a lead-gen-only map, you must pivot focus from marketing to service artifacts, inventorying every client interaction across the entire lifecycle and assigning ownership.
| Stage/Function | Example Touchpoints | Artifact/Owner |
|---|---|---|
| Sales/Risk | Technical Assessment; MSA Redlines; Security Questionnaire | Assessment Report; Legal (Owner) |
| Onboarding | Kickoff Meeting; Endpoint Rollout; MFA Deployment Plan | Implementation Roadmap; Service (Owner) |
| Delivery | Ticket Experience; Escalation Handling; Quarterly Business Review (QBR) | Status Update; Service/vCIO (Owner) |
| Renewal | Contract Scoping; Outcomes Narrative; Competitive Mitigation | Risk Posture Report; Finance/Sales (Owner) |
MSP relationships are defined by “Moments that shape trust”—stress tests unique to operational reality. These incidents largely determine retention and referrals. They include:
- The first response time during the critical Onboarding period.
- The first high-severity incident post-migration (the trust stress-test).
- The outcomes and risk posture narrative established during the first QBR.
Converting a break/fix client to a managed services contract, for instance, requires specific journey touchpoints, not general marketing. This demands a mandatory, proactive Health Check artifact coupled with a vCIO’s ROI Narrative, detailing how predictable services eliminate reactive costs. This approach ensures the map reflects the full MSP lifecycle, emphasizing delivery touchpoints that determine sustainable revenue growth.
5. Heat-Map the Journey: Creating an Operational Prioritized Backlog
Inventorying touchpoints risks treating every interaction as equally important, rendering the map an artifact with zero operational consequence. To pivot the customer journey map into an MSP revenue control surface that dictates immediate action, apply a heat map to quantify risk and opportunity. This method requires simple, repeatable scoring across three qualitative dimensions to define the prioritized backlog:
- Pain Point: Creates friction, delays decision-making, or raises client anxiety (e.g., a 48-hour wait for an Onboarding date).
- Moment of Delight: Exceeds expectation in a measurable way, generating potential for referrals or testimonials.
- Moment of Truth (MoT): Meaningfully changes the client’s decision probability regarding purchase, renewal, or expansion.
For MSPs, MoTs often occur during high-stress operational points. Two non-negotiable examples include the quality of the Sales→Service handoff (did delivery match promises?) and effective Security posture proof (providing evidence of SOC 2/CMMC-aligned controls).
Once the top five MoTs are identified, strict accountability is required. Each MoT must have a single Eigentümer (never shared), a measurable KPI, and an assigned next action. The internal heat map is always a hypothesis; validate high-score MoTs with external data, specifically customer interviews and lost deal analysis. The final output is a structured, prioritized backlog categorized by impact: quick fixes (process/copy), system fixes (tooling/instrumentation), and structural fixes (packaging/pricing).
6. Standardize Qualification: Define the True Managed Services Qualified Lead
Feeding sales unqualified contacts destroys morale and erodes MSP revenue growth. If your b2b customer journey mapping model doesn’t rigorously define the sales handoff based on readiness, you optimize for volume, not profitability. The solution is replacing the generic Marketing Qualified Lead (MQL) with a stage-gated definition that forces marketing to optimize for fit and intent.
In the managed services context, a contact is only truly Qualified when meeting all three criteria simultaneously:
Qualified Lead = Fit + Intent + Committee Coverage
- Fit: Firmographic data (employee count, vertical, location) matches your Ideal Customer Profile (ICP).
- Absicht: Behavioral signals align with the Consideration or Decision stages.
- Committee Coverage: Engagement from multiple key roles, confirming a multi-threaded opportunity.
Operationalize this using stage-based scoring. Awareness is a generic whitepaper download; Consideration signals include engagement with security posture, comparison content, or service pages. The Sales handoff must explicitly trigger on Entscheidung signals: pricing page visits, proposal requests, or technical assessment requests.
Crucially, apply a Committee Multiplier. The lead score increases significantly only when the CFO or Finance lead engages alongside the IT lead within a defined time window. Handoff criteria are met when Fit baseline, Decision Intent, and multi-role engagement are present. This attribution rigor—tracking MQL→SQL rate and time-to-SQL—differentiates scalable programs from pure volume plays, focusing resources only on opportunities ready to transact.
To drive qualified leads in the Awareness and Consideration stages, many MSPs now combine traditional SEO with Generative Engine Optimization (GEO) to appear as trusted sources in AI-powered answers (e.g., “best managed IT providers”). A real-world example is Cortavo, an MSP that generated over $1M in MQL pipeline and $210K+ in contracted revenue through a revenue-focused organic + AI search strategy. Services like Generative Suchmaschinenoptimierung (GEO) und Off-Page-SEO are particularly effective for building authority and capturing high-intent discovery traffic.
7. Engineer the Onboarding Handoff to Stop Early Churn
The Sales-to-Service handoff is the most fragile lifecycle point. Failure here breeds silent dissatisfaction, guaranteeing zero expansion and early churn—capping Net Revenue Retention (NRR) and weakening valuation. Effective b2b customer journey mapping must formalize the onboarding process to ensure delivery matches the sale.
Formalizing this requires mapping three pillars explicitly:
| Säule | Schwerpunkt | Deliverable |
|---|---|---|
| Sales Promise | Scope, SLAs, security posture, predicted ROI. | Handoff Memo/SOW verification |
| Delivery Execution | Technical discovery, tooling rollout, standardization plan. | Implementation Roadmap |
| Client Requirement | Stakeholder approvals, access provisioning, internal comms. | Mandatory Access Checklist |
Execute this disciplined approach via a tight 90-day system focused on operational trust. Week 1 completes technical discovery and populates the risk register. Weeks 2–4 implement the tooling rollout and define the communication cadence, securing quick, visible wins. By Day 30–60, schedule the first Quarterly Business Review (QBR) and articulate the long-term roadmap narrative.
To audit this phase, track key metrics: onboarding time-to-value (TTV), onboarding NPS, and first-90-day ticket volume and severity. The operational improvement is measurable: MSPs that formalized the Sales-to-Delivery blueprint have demonstrated first-year retention improvements directionally exceeding 20%. Measurement turns operational excellence into financial security. To maintain strict governance, implement an auditable onboarding touchpoint map with defined owners and timestamps.
8. Quantify the Returns: Building the Customer Journey ROI Model
CJM must be funded using finance-approved metrics, not vanity KPIs. Defining the ROI model upfront transforms B2B customer journey mapping from a cost center into a strategic investment, securing budget because its returns are measured in durable gross profit and EBITDA durability.
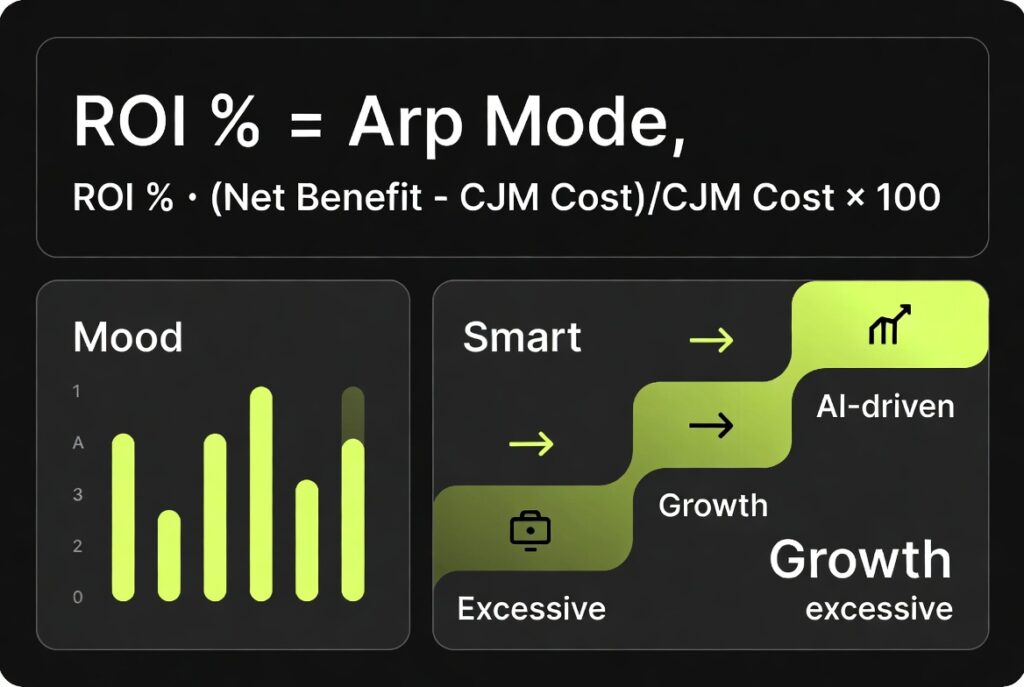
The board-friendly formula for demonstrating this value is:
$$\text{ROI} % = \frac{(\text{Net Benefit} – \text{CJM Cost})}{\text{CJM Cost}} \times 100$$
Die Net Benefit aggregates financial gains derived from journey optimization, including: retained gross profit from churn reduction, incremental gross profit from conversion lift, expansion revenue, and cost savings from reduced onboarding failures.
Translate these outcomes into hard dollars using simplified gross profit calculations:
- Churn Reduction: Incremental Annual Gross Profit $\approx$ (Revenue $\times$ Gross Margin) $\times$ (Baseline Churn $-$ New Churn).
- Conversion Lift: Incremental Gross Profit $\approx$ (Additional Closed Deals $\times$ ACV $\times$ Gross Margin).
Ensure the CJM Cost is honest by incorporating non-tooling expenses. This includes leadership workshop time, customer interviews, RevOps implementation hours, and tooling integrations.
Proving that CJM predictably reduces delivery risk and standardizes retention does more than boost revenue—it improves M&A readiness. Measurable predictability reduces diligence risk, resulting in stronger EBITDA durability and higher valuation multiples. The final artifact is a simple ROI scoreboard template tracking baseline KPIs against post-change financial outcomes.
9. The Boardroom Test: Proving CJM Value to the C-Suite and PE Partners
The ultimate validation for your b2b customer journey mapping happens in the boardroom. Leadership requires proof of predictable, durable revenue, not “marketing theater.” Your map must withstand scrutiny from finance and PE partners focused purely on risk-adjusted returns.
The internal conversation is tight and direct:
CEO: “I need to see strong growth acceleration this quarter, but I will not tolerate chaos. Is our pipeline qualified?"
CFO: “Prove the ROI math ties to gross margin and churn. I need clean attribution for diligence: Where does the Qualified Lead come from, and what is the cost of acquisition (CAC) per segment?”
PE Partner/Board: “We are concerned with retention durability. Can you show that the Onboarding phase is controlled—specifically, time-to-value and early churn—to ensure a clean NRR cohort?”
Head of Service: “Quality over volume is everything. The map defined service scope clearly, resulting in fewer onboarding escalations. Compliance and risk touchpoints (like SOC 2 evidence readiness) are handled consistently.”
This dialogue reveals a critical strategic shift: “More top-of-funnel leads” is often a negative if it increases unqualified sales load. The goal is stage velocity and conversion quality, not volume. The map must prove that sales load decreased while the MQL→SQL conversion rate increased, driving EBITDA durability.
To pass this test, your b2b customer journey mapping must function as an operating model. Commit to a single, monthly board-level KPI. Focus on the MQL→SQL conversion rate by vertical segment paired with the first-year gross churn cohort as the ultimate measure of pipeline quality and investment value.
Operationalizing the CJM: A 90-Minute Execution Schedule
The strategic value of B2B customer journey mapping is the continuous operational loop it enables. Without disciplined execution, the map remains a theoretical artifact, not the revenue control surface necessary for predictable growth. This guide moves the process from whiteboard alignment to a managed operating system by defining prerequisites, establishing a high-impact workshop agenda, and setting a mandatory reporting cadence.
Phase 1: Pre-Workshop Artifact Collection
Before gathering Sales, Service, and Marketing leaders, prepare the data that grounds the discussion in reality. Do not begin the workshop without these outputs.
- Segment Focus: Wählen Sie ONE specific segment (e.g., 20–150 seats, finance vertical) for the initial map. General maps lack the necessary specificity.
- Baseline Metrics: Pull current rolling averages for MQL→SQL conversion, sales cycle length, first-year churn, and gross margin per client cohort. This establishes the financial baseline for measuring optimization ROI.
- Required Evidence: Bring three critical artifacts: the last 10 lost deals (with detailed reasons), the last 10 onboarding timelines (start to live date), and the top 10 tickets by severity from the past quarter.
Phase 2: The 90-Minute Operationalization Workshop
This agenda forces immediate output, transforming conceptual stages into managed processes. Leave the room with owners, deadlines, and a prioritized operational backlog.
1. Define Stage Gates (10 Minutes)
Validate the six-stage MSP journey spine (Awareness through Renewal/Exit) and finalize the one-page entry/exit criteria. Output: Finalized stage-gate document.
2. Align Buying Committee Proof (15 Minutes)
Review the Buying Committee Matrix. Confirm the three most crucial proof assets required for the CFO, Security Lead, and IT Manager during the Decision stage.
3. Inventory Service Touchpoints (20 Minutes)
Use the service artifacts to map the top 10 Service/Delivery touchpoints defining Onboarding and Delivery phases. Assign a temporary owner (Service, vCIO, or Support) to each.
4. Heat-Map Moments of Truth (20 Minutes)
Heat-map touchpoints, assessing them against Pain, Delight, and MoT criteria. Select the top five critical operational MoTs for intervention. Output: A prioritized backlog of MoTs.
5. Define 3 Tactical Experiments (15 Minutes)
Define three high-impact, low-friction experiments (one acquisition, one onboarding, one retention). Assign a permanent Owner and a single measurable KPI to each experiment.
6. Set Governance (10 Minutes)
Define the mandatory reporting cadence and schedule the next follow-up meeting within 30 days.
Phase 3: The Continuous Operating Cadence
Maintain the map through routine, data-driven checks integrated into existing revenue operations meetings.
- Monthly Review: Focus on velocity and quality. Review stage conversion rates, MQL→SQL quality, and onboarding cohort Time-to-Value.
- Quarterly Review: Focus on validation. Re-run customer validation interviews (current clients and lost prospects). Update the touchpoint inventory based on new service packages or compliance demands.
Tooling Note: Data Traceability
To support accurate financial attribution, document precisely where each critical journey event is logged. Ensure the MSA/SOW signing date is logged in the CRM, the technical kickoff date is logged in the PSA, and whitepaper downloads are tracked in marketing analytics. This data link proves the map’s financial value to the C-suite.
If your firm is preparing for a roll-up or exit in the next 18 months, see the engineering framework used for the successful Eden-Daten acquisition at nuoptima.com.
FAQ
Accountability must rest with a non-siloed executive, typically the Head of CX, CRO, or RevOps Leader. While all three departments execute specific touchpoints, RevOps ensures the map functions as a unified control surface that defines handoffs and measures velocity between stages. Ownership includes enforcing data quality standards, managing the instrumentation schema, and coordinating quarterly alignment workshops.
A high-impact version one (V1) can be created in a single 90-minute cross-functional workshop to define stages and critical Moments of Truth (MoTs). The operational effort lies in the 2–4 weeks immediately following to instrument the event schema across your PSA and CRM systems and establish baseline metrics. The map should be treated as a continuous operating asset, not a one-time project, requiring routine quarterly validation.
You primarily need commitment to disciplined data logging, not new software. Start by maximizing the tools you already run: your PSA (ConnectWise/Autotask), CRM (HubSpot/Salesforce), and existing web analytics. The key technical requirement is defining a consistent Journey Event Schema—a set of shared rules—that ensures every touchpoint is logged identically across all systems, linking operational delivery to sales revenue.
Calculate ROI by measuring the delta in gross profit resulting from controlled experiments, using the cohort baseline approach (pre-optimization vs. post-optimization). Translate improvements in core metrics—such as reduced first-year churn, faster sales cycle velocity, or conversion rate lift—directly into retained and incremental gross profit dollars. Subtract the fully loaded project cost, including team time, to prove net benefit.
The most critical failure is mapping only the top of the funnel (Marketing/Awareness) and ignoring the complexity of the Onboarding and Delivery phases. Since MSP Customer Lifetime Value (CLV) is built or destroyed in service delivery, neglecting the Sales-to-Service handoff and key compliance touchpoints guarantees high early churn. The map must be operationalized with assigned owners, KPIs, and a mandatory governance cadence to enforce change.