Stop bringing traffic reports to board meetings. Your CFO ignores vanity rankings. They prioritize incremental gross profit against fully loaded cost to determine true business value.
This framework transforms seo roi from a basic traffic report into a repeatable financial model using revenue attribution and customer lifetime value. NUOPTIMA measures SEO and GEO as direct pipeline impact, providing you with a board-ready dashboard structure.
We begin by defining exactly how organic search profitability functions within your business P&L.
Key Takeaways
- SEO ROI is a financial outcome, calculated as ((Revenue from SEO minus Total SEO Costs) divided by Total SEO Costs) times 100, not a traffic or rankings report.
- Without a verified revenue attribution path through GA4 or your CRM, you only have activity metrics, not ROI.
- Track fully loaded costs across people, content, technical SEO, tools, and authority spend, and amortize one-off investments like migrations over the benefit period.
- Replace first-purchase revenue with 12-month Gross Margin LTV, which turns SEO from a monthly expense into a compounding asset story finance leaders prefer.
- Report ROI as a range between last-click and data-driven attribution to capture the floor and ceiling of impact and end internal attribution debates.
1. Define ROI as a Financial Outcome
Finance teams view clicks as a liability until they convert to cash. To align your organic strategy with board-level expectations, use this standard financial formula:
ROI% = ((Revenue from SEO − Total SEO Costs) ÷ Total SEO Costs) × 100
Total costs must account for agency retainers, internal SEO payroll, and content production software. True ROI requires money in, not vanity metrics like impressions or keyword rankings. Define “Revenue from SEO” specifically for your model:
- E-commerce: GA4 purchase revenue directly attributed to organic search sessions.
- Lead Generation: CRM-sourced closed-won revenue or lead values based on historical conversion rates.
Without revenue attribution, you do not have an ROI. You only have activity metrics. This headline KPI transforms SEO from a marketing expense into a defensible capital investment for the board.
2. Establish Your Attribution Path
Can you answer exactly how much revenue Organic Search generated last month? Without a verified attribution path, your reporting remains guesswork. Strategic seo roi measurement requires moving from vanity clicks to auditable financial data.
E-commerce path: Implement GA4 ecommerce tracking to pull revenue directly from organic acquisition reports. This provides a direct 1:1 link between search sessions and transaction value.
Lead gen path:
- Calculate Value per Lead (VPL): Average Deal Value × Close Rate.
- Assign this VPL to key conversion events like form submissions, demo bookings, and calls.
Connect your CRM (HubSpot or Salesforce) to tie organic entries to closed-won revenue for full-funnel visibility. Audit your technical setup for cross-domain tracking errors or source loss to prevent “Direct” traffic from cannibalizing SEO credit. This process produces a defensible organic revenue figure that transforms search activity into a board-ready financial metric.
3. Audit Your Fully Loaded Costs
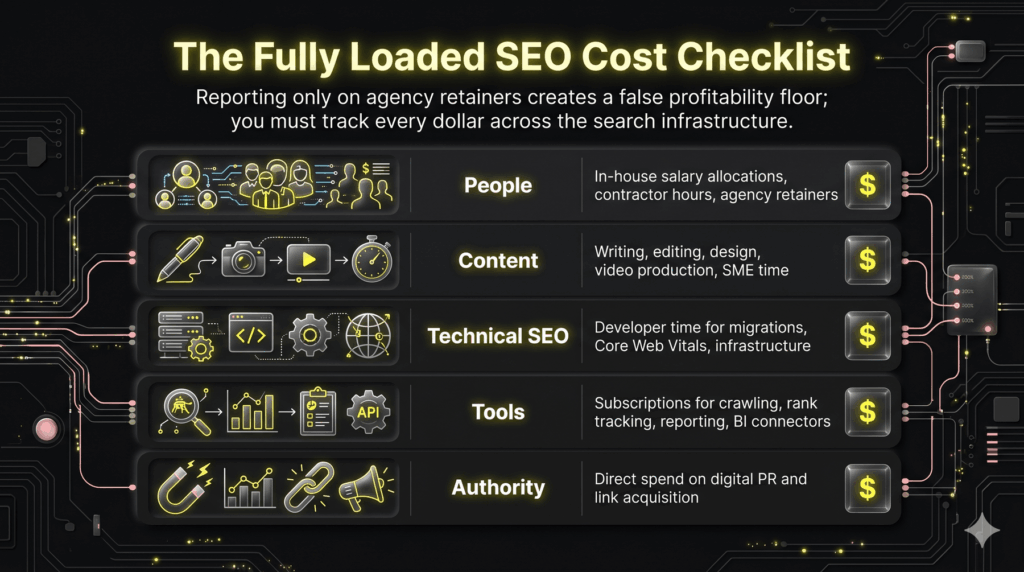
Reporting only on agency retainers makes your seo roi data flawed. Undercounting costs creates a false profitability floor that collapses against paid media benchmarks. To calculate accurate returns, you must track every invested dollar across the entire search infrastructure.
Adopt this fully loaded cost checklist:
- People: In-house salary allocations, contractor hours, and agency retainers.
- Content: Costs for writing, editing, design, video production, and SME time.
- Technical SEO: Developer time for migrations, Core Web Vitals, and infrastructure.
- Tools: Subscriptions for crawling, rank tracking, reporting, and BI connectors.
- Authority: Direct spend on digital PR and link acquisition.
Amortize one-off investments like site migrations across the benefit period to prevent data spikes. This establishes a reliable “Total SEO Cost” for executive dashboards, aligning search investment with corporate P&L standards. Consolidating these into one monthly figure ensures organic and paid channels share identical financial grounds for finance-approved reporting.
4. Shift to Gross Margin LTV
Standard reporting penalizes organic growth by focusing solely on the first transaction. First-order revenue undercounts value because search drives higher-quality customers with lower churn than interruptive paid channels. To communicate a margin-aware seo roi, replace first-purchase metrics with 12-month Gross Margin LTV.
Finance leaders prefer margin-based LTV over top-line revenue. This approach transforms SEO into a compounding asset story rather than a monthly expense. Use these practical inputs to build your model:
- Subscription: ARPA × gross margin × average retention months.
- Services: Average client value × gross margin × repeat rate.
The math then reflects business reality: ROI = (LTV-attributed organic customers, SEO cost) / SEO cost.
This transition shifts the focus from click costs to long-term asset value. It ensures your seo roi aligns with actual profit generation. You prevent underestimating organic performance by valuing customers based on lifetime profit rather than initial clicks.
5. Report ROI Using Multi-Touch Sensitivity
Last-click attribution often under-credits SEO because organic search usually provides the initial discovery or middle-funnel assist. Relying on one model creates “attribution politics” that jeopardize budget requests. Present seo roi as a sensitivity analysis using three distinct lenses:
- Last-click: A conservative, audit-ready baseline for finance.
- First-touch: Captures SEO’s role in demand creation and brand discovery.
- Data-driven (DDA): The GA4 default assigning fractional credit across the customer journey.
Present ROI as a range between Last-click and DDA to capture the floor and ceiling of impact within complex B2B cycles. Lock these models for quarterly reviews to ensure reporting survives executive scrutiny. Formalizing this methodology stops internal debates over channel credit and prevents “moving goalposts.” Use this range to justify investment based on both immediate conversion and pipeline contribution.
6. Segment ROI by Page and Topic Cluster
Sitewide seo roi often masks inefficiency. A healthy average can hide a portfolio where 20% of pages drive 80% of revenue while the rest drain budget. Auditing performance at the page level reveals exactly where profit originates, turning a retrospective scorecard into a tactical decision system.
Segment organic traffic by landing page, topic cluster, and brand versus non-brand queries. Calculate value by attributing lead value or revenue to the entry page. To find true margin, subtract specific asset costs:
- Content production
- Backlink acquisition
- Technical developer hours
This granularity identifies which pages deserve more budget. Double down on high-ROI clusters with scalable demand. Refresh pages that rank well but suffer from weak conversion rates. Use these insights to allocate capital based on conversion potential rather than traffic volume. This creates a prioritized SEO roadmap tied to profit.
7. Build Forecast Models for Predictive SEO ROI
Most organic strategies fail in the boardroom because they rely on hope. To secure investment, distinguish between Projected ROI (the forward-looking budget case) and Actual ROI (the backward-looking performance report).
Build a lightweight forecast using this data-driven workflow:
- Select a target page or high-intent keyword set.
- Estimate incremental clicks using CTR uplift assumptions (e.g., moving from position 8 to 2).
- Apply your CRM’s observed conversion rates to these sessions.
- Multiply by average lead value or Customer Lifetime Value (LTV).
- Subtract fully-loaded SEO costs, including agency fees, content production, and technical tools.
Present three scenarios: conservative, likely, and aggressive. This transparency builds finance-level trust and accounts for market volatility. Forecasts get budgets approved; actuals keep budgets defended. This framework enables budget justification through realistic revenue scenarios rather than traffic-based promises.
8. Build an SEO Report Dashboard for ROI Attribution
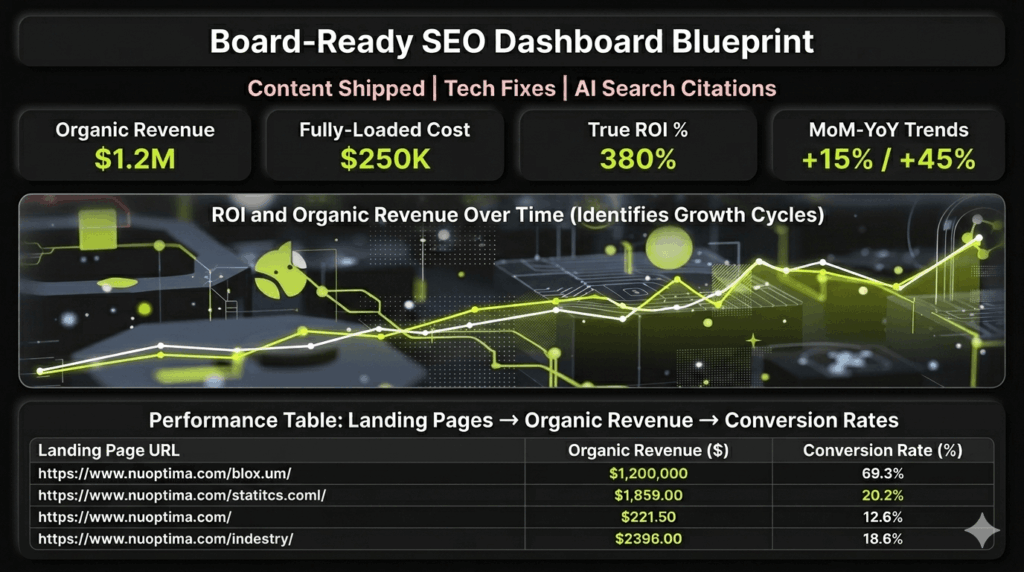
Dashboards exist to answer one question: what did you spend, and what did you get back? Move beyond ranking spreadsheets to a revenue-first view that tracks your seo report dashboard roi with these essential blocks:
- Scorecards: Organic revenue, total fully-loaded SEO cost, ROI percentage, and MoM/YoY trends.
- Trend Chart: Visualize ROI and organic revenue over time to identify growth cycles.
- Performance Table: Landing pages mapped to organic revenue, conversions, and conversion rates.
Integrate GA4 and Search Console for traffic data, but use a Google Sheet for cost inputs to maintain a clean source of truth. Include an executive summary header with three bullets detailing content shipped, technical fixes, and AI search citations. These updates demonstrate an ongoing operational effort to optimize content for AI search systems. If you need this dashboard built end-to-end to prove your seo roi, visit nuoptima.com.
9. Measure AI Search Visibility and GEO ROI
B2B buyers research in ChatGPT, Gemini, and Perplexity before ever reaching Google. While this visibility is often zero-click, it remains revenue-impacting. To calculate modern seo roi, you must track AI answer engine optimization presence as a leading indicator of demand. Traditional analytics are blind to this shift; you must pivot to answer-engine metrics.
Prioritize actionable indicators over vanity impressions:
- AI citations and mentions for high-intent category queries.
- Direct traffic and assisted conversions from known LLM referrers.
- Lift in branded search volume following sustained citation growth.
Treat AI mentions as a strategic pipeline signal, though revenue attribution remains the final source of truth. Validate the financial impact of your GEO services by tracking pipeline deltas across pre and post-optimization periods. This framework ensures marketing leaders justify spend by capturing ROI across both Google and the emerging answer engine ecosystem.
FAQ
A good return typically ranges from 5x to 10x your total investment, but these benchmarks are strictly directional. Your specific return depends on your market maturity, competitive density, and customer lifetime value (LTV) variance. Instead of relying on generic industry averages, compare your organic returns against your paid customer acquisition cost (CAC) and payback periods. We recommend using your own trailing 6 to 12 months of performance as a baseline to set realistic growth targets.
Financial ROI typically materializes between 6 and 12 months for most B2B service businesses. However, it is vital to separate leading indicators from lagging indicators. Leading indicators include indexation, technical health improvements, and rankings on high-intent money terms. Lagging indicators are the actual revenue and pipeline figures. We suggest maintaining a monthly operational reporting cadence to track these early signals, while reserving financial reviews for a quarterly basis to account for search engine cycles.
We recommend presenting a range that includes both last-click and data-driven attribution (DDA) to make your reporting assumptions explicit. Last-click offers a conservative, audit-ready baseline that finance teams often prefer. Conversely, DDA captures the earlier discovery and middle-funnel roles that organic search often plays in the customer journey. Once you select your framework, lock the model for all executive reporting to ensure consistency. See the section on Multi-Touch Sensitivity above for a detailed breakdown of these models.
If you have weak CRM data or no e-commerce functionality, use monetized events as an interim measurement. Calculate a Value per Lead (VPL) by multiplying your average deal value by your historical close rate. Assign this value to key conversions like form submissions or demo bookings. Simultaneously, run a short instrumentation sprint to map your forms to your CRM and improve source capture. This approach ensures you track business outcomes while your data infrastructure matures. Refer to the section on Attribution Paths for more guidance.
An effective executive report should center on three core numbers: total fully loaded spend, revenue or LTV-weighted pipeline, and the resulting ROI percentage. Support these metrics with three primary drivers that explain which actions shifted the numbers, such as specific content clusters or technical migrations. This high-level view connects search activity to the broader business P&L. If you need an ROI-grade measurement system to prove your impact, visit Nuoptima to learn about our GEO services and advanced search strategies.
Where this fits in your MSP growth system
This is one piece of how NUOPTIMA makes MSPs and cybersecurity firms the provider buyers find on Google and in AI search. See how it connects to MSP SEO and GEO and AI-search, or get your free MSP lead forecast to see exactly where your firm shows up across ChatGPT, Gemini, and Perplexity today.