Founded in 2006, Twitter has long been a popular social media platform for users across the globe. But what do the statistics reveal about this platform? How many people use Twitter? How many Twitter users are male? How many tweets are sent out per second? How does it stack up in terms of brand interaction? This article reveals statistics about Twitter that are important to know in 2025.
Interesting Twitter Stats
Twitter Content
Research conducted by Pew Research Center found that a small number of users are responsible for a large amount of content on the platform. Focusing on United States (US) adults, it found that 10% of Twitter users created 92% of all Tweets.
How Often An Average User Tweets
The average user Tweets just two times a month.
Importance of News on Twitter
Statistics released by Twitter demonstrate that users are keen news readers. 94% of users show an interest in current events. Moreover, 55% of users get their news updates from the platform.
Twitter Popularity
According to Statista, as of January 2023, the site is the 14th biggest social media platform, based on the number of Twitter monthly active users (MAUs). Other platforms that ranked higher include Facebook in first place, Instagram in fourth, TikTok in sixth, and Snapchat in 10th position.
Market Cap
As of March 2023, Twitter’s market cap is $41.09 billion, making the platform the globe’s 408th most valuable business by market cap.
Most Popular Time to Post
The most common time to post on Twitter is between 8 am – 10 am and 6 pm – 9 pm. These times are generally right before and right after work hours.
The Sport Tweeted About the Most
Football — or soccer — is the most Tweeted about sport on Twitter.
Interesting Twitter Statistics Summarised
Twitter Content
10% of Users Created 92% of All Tweets (From US Adults)
Average Tweets Per Month Per User
2
Importance of News
94% of Users Show an Interest in Current Events
Popularity
14th Biggest Social Media Platform
Market Cap
$41.09 Billion
Most Popular Time to Post
8 am – 10 am And 6 pm – 9 pm
The Sport Most Tweeted About
Football (Soccer)
Twitter User Demographics
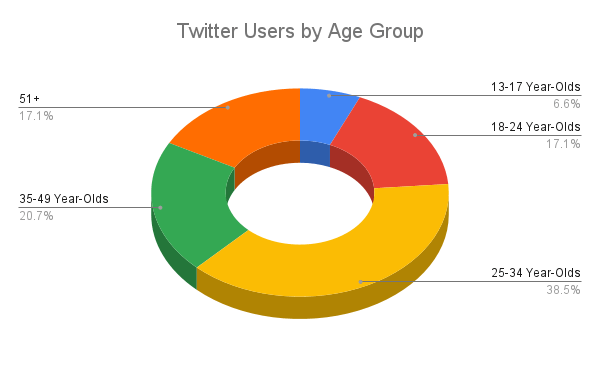
Age Groups Using Twitter
Data compiled in mid-2021 found that the largest age group using Twitter was 25-34 year-olds (38.5%), followed by 35-49 year-olds (20.7%). Both 18-24 year-olds and the 50+ age group accounted for 17.1%, and the smallest audience was 13-17 year-olds, making up just 6.6% of Twitter’s total users. This data illustrates that an older audience generally uses Twitter compared to other platforms, such as TikTok, which has 18-24 year-olds as its most popular age group.
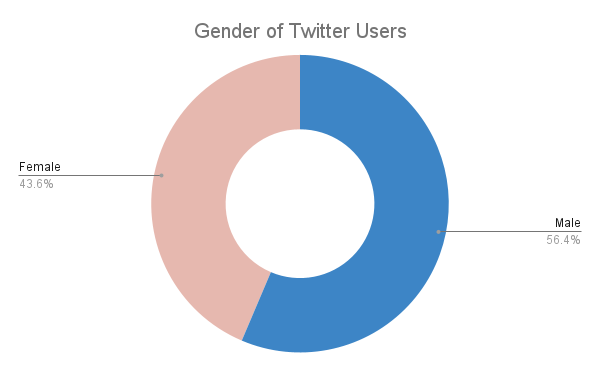
Gender
Twitter is more popular with males. As of January 2022, 56.4% of worldwide Twitter users were male, while 43.6% were female. This again differs from TikTok, with 54% of its users female.
Country With the Most Users
The latest data in 2023 indicates that the country with the most users is the USA, with at least 95.4 million active US Twitter users. This is followed by Japan (67.5 million), India (27.3 million), Brazil (24.3 million), Indonesia (24 million), and the UK (23.2 million).
Percentage of Americans Using Twitter
A 2022 survey found that 27% of US adults use Twitter. Regarding other platforms, around 70% of US adults use Facebook, 28% use Pinterest, and 81% use YouTube.
Twitter User Demographics Summarised
Most Popular Age Group
25-34 Year-Olds (38.5%)
Gender
56.4% Male
Country With Most Users
USA (At Least 95.4 Million)
Percentage of US Adults on Twitter
27%
Twitter Usage Statistics
Twitter Daily Active Users (DAUs)
In November 2022, Elon Musk announced that Twitter has 259.4 million DAUs. Also, as of 2023, Twitter has approximately 450 million MAUs.
Number of Tweets Per Second
As of August 2022, around six thousand Tweets are sent per second. This equates to 350 thousand Tweets per minute, 500 million Tweets per day, and 200 billion Tweets per year!
Average Hours Per Month Spent on Twitter
A study from 2022 showed that users spend approximately 1.1 hours per week using Twitter, which equals 4.4 hours per month. While this may seem small for a social media platform, especially compared to the average of 95 minutes spent daily on TikTok, Twitter has a different and more mature demographic.
Twitter Usage Statistics Summarised
DAUs
259.4 Million
Number of Tweets Per Second
6,000
Average Hours Per Month on Twitter
4.4 Hours
Twitter Marketing Statistics
Increase in Ad Engagement
Statista announced in July 2022 that in the second quarter of 2022 (April-June), the platform’s ad engagement increased by seven per cent compared to the same quarter of 2021.
Time Spent Viewing Ads
In February 2021, the Twitter Business account Tweeted that people spend 26% more time watching adverts on Twitter compared to other social media platforms. This indicates that Twitter is a great place for businesses to advertise, raise brand awareness, and potentially gain new customers.
Twitter Marketing Statistics Summarised
Increase in Ad Engagement
7% Increase (From Q2 2021 – Q2 2022)
Time Spent Viewing Ads
26% More Than On Other Platforms
Twitter Business Statistics
Brands Followed by Users
The median Twitter user follows just five brands on the platform.
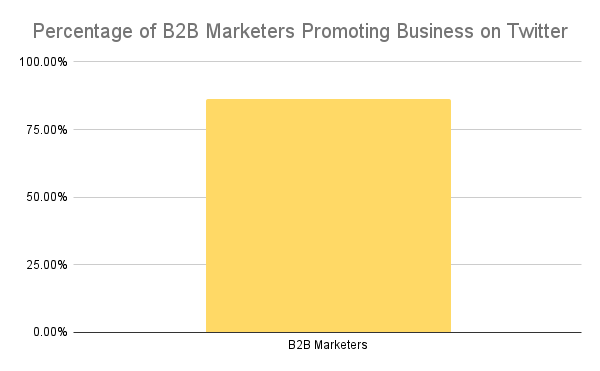
B2B Marketers Promoting on Twitter
Twitter is one of the most popular social media platforms for B2B marketing. And the statistics back it up. More than 86% of B2B marketers promote their brand on the platform.
Return on Investment (ROI)
Twitter announced that studies show the average Twitter Ads have 40% higher ROI compared to other channels, demonstrating that it can be a profitable platform to advertise on.
Poor Hashtag Use
Almost 20% of users will unfollow a business on Twitter if they use hashtags poorly. Therefore, businesses need to get the balance just right.
Brand Interaction
A study on how people engage on social media with brands found that Twitter ranked first for brand interaction. Additionally, around 80% of all Twitter users have Mentioned a business when Tweeting. This means it presents a great opportunity to connect with customers and grow the reputation of your business.
Twitter Business Statistics Summarised
Average Number of Brands Followed By Users
5
Percentage of B2B Marketers Using Twitter to Promote Their Brand
Over 86%
ROI
Ads Have 40% Higher ROI (Compared to Other Channels)
Percentage of Users Who Will Unfollow a Brand for Poor Hashtag Use
20%
Brand Interaction on Social Media
Ranked 1st
Twitter Platform Statistics
Amount Spent on Sales and Marketing
In 2021, Twitter spent approximately $1.17 billion on sales and marketing. This is a marked increase from 2020 when $887 million was spent.
Advertising Revenue
Twitter generated $5.01 billion in ad revenue in the year 2021. This amount is predicted to increase and reach $9.6 billion by 2026.