Pinterest is a popular social media platform launched in 2010 that lets users find and share ideas and interests. But there are many important statistics that are valuable to know about the site in 2023. Read this article to uncover these interesting facts about Pinterest. For instance:
- What are the most popular categories?
- What country has the most users?
- What is Pinterest’s ad revenue?
5 Intriguing Pinterest Statistics
- Popular for New Projects
Pinterest is a self-proclaimed ‘visual discovery engine’ to help users find inspiration, such as for home decoration and cooking recipes. Statistics revealed by Pinterest show that 61% of users go to Pinterest to start a new project.
- Increase in Board Creation
In late 2020, Pinterest announced that there had been a surge in the number of boards created on a monthly basis, a trend partly driven by the COVID-19 pandemic. In particular, there was a notable rise in new boards focused on gifts, home improvement, popular home automation, essential goods, baby products, and at-home workouts. These categories also experienced a significant increase in saved Pins and search activity as users planned, upgraded, and adapted their living spaces.
- Most Popular Categories
The most popular category on Pinterest is Home Decor. It has over 682 million boards and 23 billion pins. The second most popular is DIY and Crafts, with over 444 million boards and 19 billion pins, and the third is Food and Drink, with more than 18 billion recipes saved by Pinners.
- Number of Pins Saved
To date, platform users have saved over 240 billion pins across over four billion boards. Past trends from 2022 include menstrual care, gothic home decorations, and rebel haircuts.
- Time Spent on the Platform Daily
The average user spends 14.2 minutes on Pinterest daily. This is quite a lot shorter than on other social platforms. For instance, the average user spends 30 minutes and 95 minutes per day on Snapchat and TikTok, respectively.
| Fun Pinterest Statistics Summarised | |
| Percentage of Users Going to Pinterest to Begin a New Project | 61% |
| Board Creation | Increase in Boards Created Monthly, Especially Concerning Gifts, Home Improvement, Essential Goods, Baby Products, and At-Home Workouts. |
| Most Popular Categories | Home Decor (Over 682 Million Boards, 23 Billion Pins)DIY and Crafts (Over 444 Million Boards, 19 Billion Pins)Food and Drink (More Than 18 Billion Recipes) |
| Number of Pins Saved | More Than 240 Billion Pins Across Over 4 Billion Boards |
| Average Time Spent on Pinterest Daily | 14.2 Minutes |
3 Pinterest User Demographics
- Gender
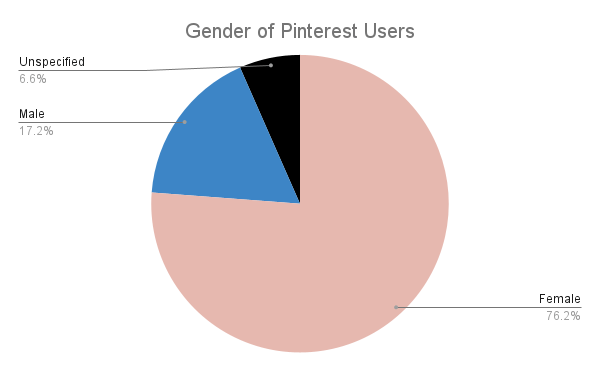
As of January 2023:
- 76.2% of all Pinterest users that were 13 years old and above were female,
- 17.2% were male, and
- 6.6% were unspecified.
Other social media platforms with more female users than males include Snapchat and TikTok, while those with a higher male demographic include YouTube, Facebook, and Twitter. Regarding the UK specifically, as of January 2023:
- 72.6% of users on Pinterest were female,
- 21.7% were male, and
- 5.7% were unspecified.

- Countries With the Most Pinterest Users
Statista’s study from January 2023 found that:
- 84.6 million Pinterest users were in the United States (US). This figure is far higher than any other country.
- The country with the second most Pinterest users was Brazil, with 28.05 million users.
- Mexico was placed third, with 19.45 million users.
- Germany ranked fourth, with 15.88 million users.
- Pinterest Age Demographics
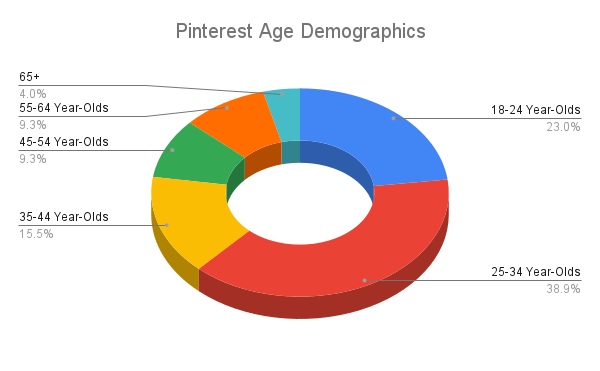
As of January 2023:
- The most popular age group on Pinterest was 25-34 year-olds, accounting for 38.9% of the total users.
- This was followed by 18-24 year-olds, amounting to 23%.
- 35-44 year-olds accounted for 15.5%.
- 45-54 year-olds and 55-64 year-olds each accounted for 9.3%.
- The 65+ age demographic made up just 4%.
The most popular demographic on Pinterest was females aged between 25 and 34, making up 28.5% of Pinterest’s global audience.

| Pinterest User Demographics Summarised | |
| Gender of Users | 76.2% Female |
| Country With the Most Users | US (84.6 Million) |
| Most Popular Age Demographic | 25-34 Year-Olds (38.9%) |
4 Pinterest Usage Statistics
- Mobile Users
Since 2018, the number of people using Pinterest with a mobile device has been above 80%. The latest numbers reveal that 82% of people currently use mobile to access Pinterest.
- Pinterest Monthly Active Users (MAUs)
The number of Pinterest MAUs as of Quarter 4 of 2022 was 450 million, but in Quarter 3 of 2022, Pinterest’s MAUs were 445 million. So, the platform gained five million more MAUs by the close of 2022. Pinterest hit its peak of MAUs in Q1 2021 with 478 million MAUs. It then witnessed a gradual decline but is now clearly back on the rise.
- US Site Visits
In December 2022, Pinterest was the second most visited social media site in the US, with 15.85% of all site visits, falling behind Facebook with 49.93%. It is interesting to note that the US has the third biggest social media audience globally.
- Pinterest Popularity
Based on the number of MAUs, Pinterest ranked 15th in a Statista survey about the biggest social media platforms. Other sites that ranked higher include Facebook in first place, YouTube in second, Instagram in fourth, and TikTok in sixth position.
| Pinterest Usage Statistics Summarised | |
| Mobile Users | 82% of People Use Mobile for Pinterest |
| MAUs | 450 Million (Quarter 4 of 2022) |
| US Most Visited Social Media Sites | Pinterest Ranked Second (15.85%) |
| Pinterest Popularity | 15th Biggest Social Network |
3 Pinterest Shopping Statistics
- Pinterest UK and Global Users Making a Purchase
Over 60% of users in the United Kingdom have gone on to buy something after seeing branded content on Pinterest. Plus, 83% of weekly users worldwide have bought something based on the content they saw from businesses on the platform. This demonstrates that many users shop on the platform, which can be an excellent place for a brand to market its goods or services.
Furthermore, Pinterest’s Feed Optimisation Playbook states that Pinners are 75% more likely to say they are always shopping and 40% more likely to say they love to shop. This once more shows that the platform is a great hub for advertising to potential customers.
- Pinners Spend More Comparatively
Interestingly, Pinners tend to spend 40% more per month when shopping on the site compared to people on other social media platforms. Data has also shown that high-income households are twice as likely to use Pinterest compared to low-income houses. This means it is a great place for items with a higher price point, such as high-end clothing and furniture.
- Users Planning Purchases
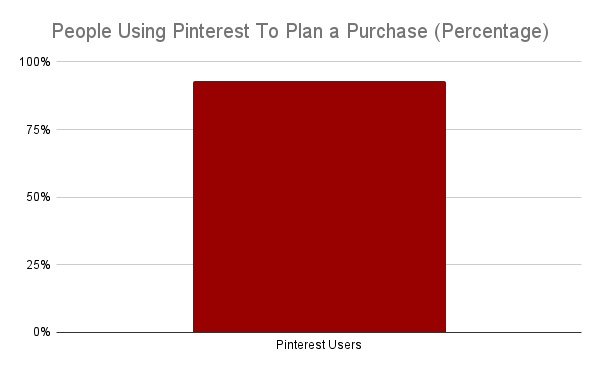
It has been shown that 93% of people use Pinterest to plan a purchase. This extremely high statistic is attributed to Pinterest’s ability to inspire its users, such as for makeup and new hobbies to try.

| Pinterest Shopping Statistics Summarised | |
| Percentage of Global Weekly Pinterest Users That Have Made a Purchase After Seeing Branded Content | 83% |
| How Much More Money Pinners Spend Compared to People on Other Platforms? | 40% |
| Percentage of People Using the Platform to Plan a Purchase | 93% |
2 Pinterest Search Statistics
- Branded vs Unbranded Search
Up to 97% of searches on Pinterest are unbranded. This means people are considering what to buy and haven’t settled on a brand yet. Businesses can therefore take advantage of this and attract users during their decision-making process.
- Pinterest Searches Per Month
Over two billion searches occur on Pinterest monthly. Pinterest is, therefore, a popular location for people to conduct searches. Common searches made are about beauty, travel, fashion, and food and drink.
| Pinterest Search Statistics Summarised | |
| Percentage of Unbranded Searches | 97% |
| Number of Pinterest Searches Monthly | Over 2 Billion |
4 Pinterest Advertising and Marketing Statistics
- Ad Revenue
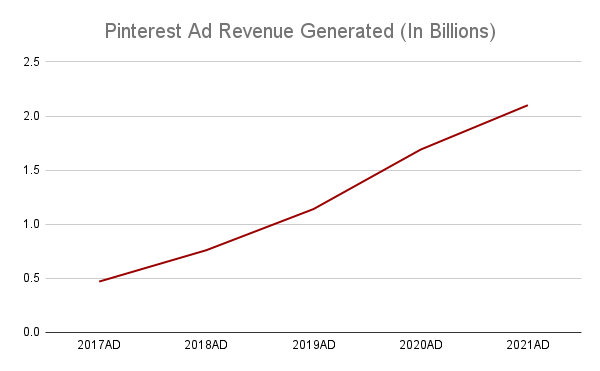
The latest figures reveal that Pinterest generated $2.1 billion in ad revenue in 2021. This has increased from the previous four years, which generated the following ad revenue numbers:
- 2017 = $0.47 billion
- 2018 = $0.76 billion
- 2019 = $1.14 billion
- 2020 = $1.69 billion
Pinterest’s ad revenue is predicted to continue to increase and hit $4.13 billion by the year 2026. The platform is currently responsible for roughly 0.5 per cent of the worldwide ad revenue.

- Advert Cost-Per-Click (CPC)
On Pinterest, you can expect to spend between $0.10-$1.50 per click. This is much cheaper compared to certain other social media platforms, such as LinkedIn, with an average CPC of $5.39.
- Best Time to Pin on Pinterest
According to a recent study, the best hours to post on the platform are 8 pm, 4 pm, 9 pm, 3 pm, and 2 pm. As we can see, these are all hours in the afternoon. Conversely, the worst hours to post are midnight, 1 am, 6 am, 4 am, and 5 am. Interestingly, these are all hours before midday. Additionally, the best days of the week to post on Pinterest are Sundays, Mondays, and Tuesdays.
- Lifespan of Pins
Research from Pinterest reveals that the average lifespan of a Pinterest post is 105 days. This is a significant increase compared to roughly five hours on Facebook, 20 minutes on Twitter, and two days on Instagram. Therefore, Pinterest is a valuable platform for advertisers looking to continually attract consumers without needing to create fresh content every few hours.
| Pinterest Advertising and Marketing Statistics Summarised | |
| Ad Revenue | $2.1 Billion (2021) |
| Ad CPC | $0.10 – $1.50 |
| Best Times to Post | 8 pm, 4 pm, 9 pm, 3 pm, 2 pm. |
| Lifespan of Pins | 105 Days |


