Instagram is a social media platform that was launched in 2010. It was then acquired by Facebook in 2012. It is without question one of the biggest websites worldwide. But what are some valuable statistics to know about the platform? For example:
- How many downloads does Instagram have?
- What is the average time spent on Instagram daily?
- What percentage of users follow a business?
Browse this article to uncover 24 vital stats about Instagram for 2023.
Insightful Instagram Statistics
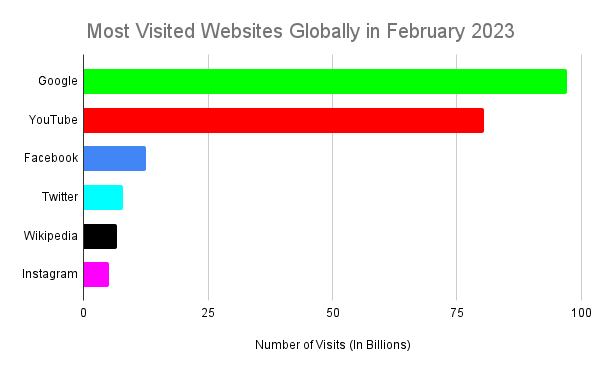
- Highly Visited Website
According to Semrush’s February 2023 data, Instagram was the sixth most visited website globally, with over 5.2 billion visits in that one month alone. Websites that ranked higher were Google with around 97 billion visits, YouTube with 80.5 billion, Facebook with 12.5 billion, Twitter with 7.9 billion, and Wikipedia with 6.7 billion monthly visits. This is illustrated in the bar chart below:
- Number of Worldwide Users
As of October 2022, Instagram’s Daily Active Users (DAUs) globally stand at an impressive 1.386 billion people. When we consider Instagram’s Monthly Active Users (MAUs), this figure increases to over two billion people (as of January 2023).
- Total Number of Downloads
To date, the social media platform has been downloaded roughly 3.8 billion times! In 2022, Instagram was the second most-downloaded app with 548 million downloads, falling behind TikTok with 672 million downloads.
- Most-Liked Instagram Post
As of March 2023, the most-liked post on Instagram is a carousel of footballer Lionel Messi and his Argentinian teammates celebrating winning the 2022 FIFA World Cup in Qatar. It was posted on 18th December 2022 and has been liked by more than 75 million users. Plus, it is the most-liked post ever across every social media website!
| Fun Instagram Statistics Summarised | |
| Highly Visited Website | Sixth Most Visited Site Globally |
| Number of Worldwide Users | DAUs: 1.386 Billion MAUs: Over 2 Billion |
| Total Number of Downloads | 3.8 Billion |
| Most-Liked Instagram Post | Lionel Messi Celebrating Winning the FIFA World Cup |
Instagram User Statistics
- Age of Instagram Users
Most Instagram users are 18-34 years old, comprising over 61% of its total user demographic. According to Statista, here is a breakdown of what percentage each age group accounts for on the platform as of January 2023:
- 13-17 year-olds: 8%
- 18-24 year-olds: 30.8%
- 25-34 year-olds: 30.3%
- 35-44 year-olds: 15.7%
- 45-54 year-olds: 8.4%
- 55-64 year-olds: 4.3%
- 65+: 2.6%
- Country With the Most Users
As of January 2023, the following countries had the most users:
- India: 229 million users.
- United States (US): 143 million users.
- Brazil: 113 million users.
- Indonesia: 89 million users.
The United Kingdom (UK) ranked eighth with 28 million users. Interestingly, India is also the country with the biggest Facebook and YouTube audience.
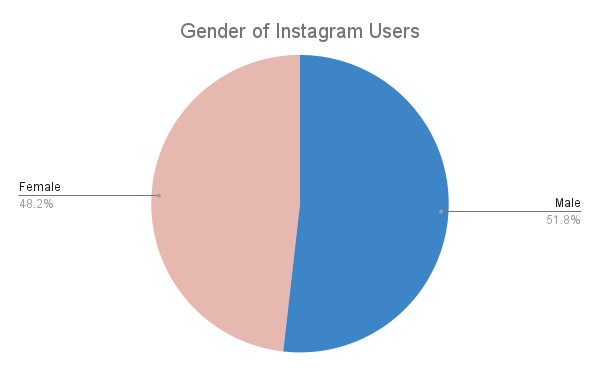
- Gender of Instagram Users
51.8% of Instagram’s users are male, and 48.2% are female, according to a January 2023 Statista survey. Other social media platforms that have a higher ratio of male users include LinkedIn, Facebook, Twitter, and YouTube. Platforms that have a higher female demographic include TikTok and Snapchat.
| Instagram User Statistics Summarised | |
| Most Popular Age Demographic | 18-24 Year-Olds (30.8%) |
| Country With The Most Users | India |
| Gender of Users | 51.8% Male |
Instagram Usage Statistics
- Time Spent on App
Recent data has shown that Instagram users spend an average of 51 minutes on the app daily. TikTok ranked first in this category with an average of 95 minutes spent daily, and YouTube ranked second with 74 minutes. However, Instagram still ranked better than Facebook (49 minutes), Twitter (29 minutes), and Snapchat (21 minutes).
- Instagram User Growth
The number of users in 2023 reveals a 5.47% annual increase from last year. While this figure looks impressive, it was slower than the previous year, which was 5.79%. The number of Instagram users is forecast to keep rising, but growth is predicted to be slower. Its user growth is estimated at 3.7% in 2024 and 2.86% in 2025.
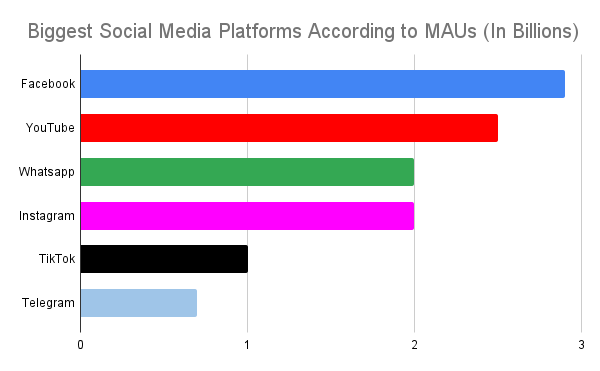
- Instagram Popularity
As of January 2023, Instagram ranked as the fourth biggest social media platform, according to MAUs. Facebook ranked top with 2.9 billion MAUs, YouTube second with 2.5 billion, and Whatsapp and Instagram ranked third and fourth, respectively, with approximately two billion MAUs each. TikTok placed sixth with one billion and Telegram ninth with 0.7 billion (700 million). The chart below visualises this data:
| Instagram Usage Statistics Summarised | |
| Average Time Spent on App Daily | 51 Minutes |
| User Growth | 5.47% Annual Increase (2023) |
| Instagram Popularity | 4th Biggest Social Media Platform |
Instagram Reels Statistics
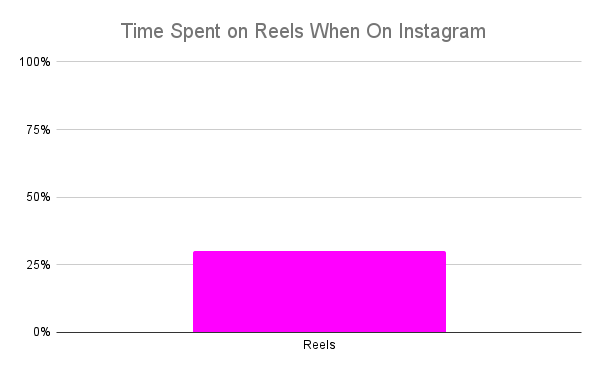
- Time Spent On Reels
Research has shown that Reels account for 30% of the average time spent on the platform. This illustrates that Reels can be a great part of any brand marketing strategy.
- Songs on Reels
Meta announced that 15 of the top 20 most used songs globally on Reels are by Indian artists. With Instagram’s biggest user base in India, it makes sense that Indian music is a common feature on Reels.
- Engagement Rates
Instagram Reels generate 67% more engagement compared to regular Instagram videos. Therefore, Reels can help brands increase visibility, awareness, and customer interactions.
| Instagram Reels Statistics Summarised | |
| Time Spent on Reels | 30% |
| Songs on Reels | 15/20 Most Used Songs on Reels Are By Indian Artists |
| Reels Engagement Rates | 67% More Than Standard Instagram Videos |
Instagram Stories Statistics
- Instagram Stories DAUs
Research suggests that there are 500 million (half a billion) daily active Stories users. Consequently, there is a vast potential audience for marketers to connect with through Stories.
- Businesses Using Stories
36% of brands use Instagram Stories to promote their products and services. Top companies that use Instagram stories include Abercrombie & Fitch, NASA, and National Geographic.
- Mobile-Shot Stories Ads
According to Instagram, Stories adverts shot on mobile have a 63% chance of performing better than studio-shot adverts. Furthermore, it states that mobile-shot ads do better in terms of ad recall and intent. On the other hand, studio-shots tend to outperform mobile-shots in driving higher brand awareness.
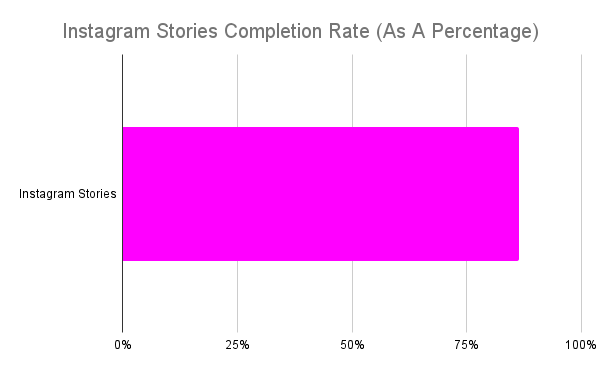
- Completion Rate
Completion Rate is how many people have watched a Story from beginning to end. The average Completion Rate for Instagram Stories is 86.5%. Generally speaking, the higher the follower count, the healthier the Completion Rate. This impressive statistic illustrates that many people (and potential customers) watch Stories from start to finish. However, it is still important that businesses offer captivating content to ensure the user’s interest is held.
- User Interest in Brands
62% of users say they have a greater interest in a brand after seeing it on Instagram Stories. Businesses can therefore engage potential customers simply by posting on Stories. Moreover, recent Instagram statistics reveal that half of all Instagram users have gone to a website to make a purchase after they have seen it on Instagram Stories. Stories can therefore be a great way to direct people to a business website and persuade consumers to buy products.
| Instagram Stories Statistics Summarised | |
| Instagram Stories DAUs | 500 Million |
| Businesses Using Stories | 36% |
| Chance of Mobile-Shot Stories Ads Outperforming Studio-Shot Ads | 63% |
| Completion Rate | 86.5% |
| Percentage of Users With Greater Interest in a Brand After Seeing it on Stories | 62% |
Instagram Business Statistics
- Product Research
A survey commissioned by Facebook found that 81% of participants use Instagram to help them research products and services.
- Number of Business Accounts
To date, there are more than 200 million business profiles on Instagram.
- Business Account Posting
Instagram business accounts post an average of 1.56 times daily to their main feed.
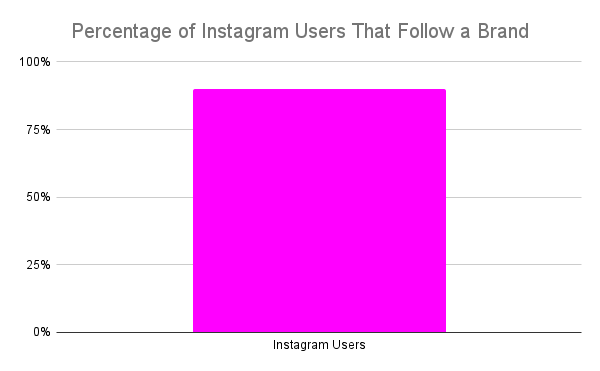
- Percentage of Users That Follow a Business
Instagram announced that 90% of its users follow at least one brand. Moreover, the same survey found that Instagram was the number one media platform for creating relationships with businesses.
| Instagram Business Statistics Summarised | |
| Percentage of People Using Instagram to Research Products and Services | 81% |
| Number of Business Accounts | Over 200 Million |
| How Often do Business Accounts Post? | 1.56 Times Daily (On Average) |
| Percentage of Users That Follow a Business | 90% |
Instagram Advertising and Marketing Statistics
- Influencer Campaigns
In 2022, 72% of marketers used Instagram for influencer campaigns. In 2023, this figure is expected to increase by 4.1%.
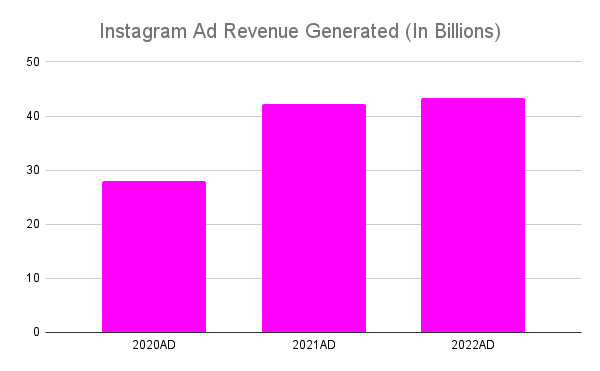
- Ad Revenue
In 2022, Instagram generated $43.28 billion in ad revenue. This is an increase from 2021, where the platform saw a total ad revenue of $42.18 billion, and 2020, which generated $28.08 billion in ad revenue. The bar chart below illustrates this:
- Advertising Reach
Instagram adverts reach almost 97% of the platform’s monthly active user base. Therefore, businesses can reach nearly two billion people through marketing on Instagram.
| Instagram Advertising and Marketing Statistics Summarised | |
| Percentage of Marketers Using the Platform for Influencer Campaigns | 72% |
| Ad Revenue | $43.28 Billion (2022) |
| Ad Reach | Almost 97% of Instagram’s Active User Base Monthly |