The confusion surrounding msp owner salary is the most expensive mistake founders make when preparing for an exit. You must cleanly separate three financial concepts: compensation, true operational profit, and personal distributions. Blurring these streams obscures your leverageable EBITDA and cripples your valuation when Private Equity performs normalization adjustments. To maximize enterprise value, we will use a numbers-first methodology that starts by isolating these three financial buckets, ensuring every benchmark is clean and comparable.
MSP owner salary normalization is the adjustment a buyer makes to restate your compensation at the true replacement cost of the work you do, so reported profit reflects a business that runs on a hired executive rather than a founder. It is the single line that most often separates the EBITDA you report from the EBITDA a buyer will actually pay a multiple on.
Key Takeaways
- Cleanly separate three financial buckets before benchmarking: salary (W-2 pay for labor), distributions (profit taken on equity), and retained profit (cash kept in the business).
- Private Equity buys normalized EBITDA, so benchmark your pay against the replacement cost of a non-owner CEO or COO doing your role, not your actual take-home.
- The median MSP runs 12 to 15 percent adjusted EBITDA, while top-quartile firms operate at 20 to 25 percent or higher, which drives a premium valuation multiple.
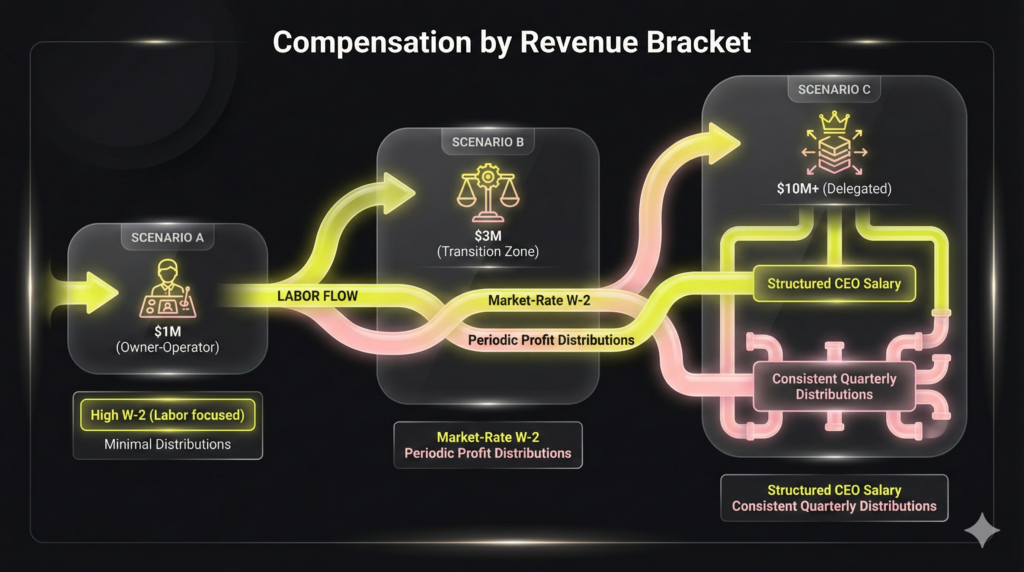
- Compensation should match your operational role by revenue tier: high W-2 for a $1M owner-operator, market-rate CEO pay plus distributions at $3M, and structured non-owner-CEO pay plus quarterly distributions at $10M+.
- Protect M&A readiness by keeping 6 to 8 weeks of payroll in reserve, setting aside taxes before any distribution, and documenting reasonable compensation to stay IRS-defensible.
1. The Three Buckets That Determine True MSP Profitability
Achieving M&A readiness requires separating your personal cash flow from the firm’s operational performance. Blurring these streams is the structural flaw Private Equity firms immediately flag and normalize, often resulting in a lower valuation multiple than the owner expected.
Profitability requires defining three financial buckets:
- Salary (W-2/Guaranteed Payments): Compensation paid for the owner’s labor and defined operational role within the business.
- Distributions/Draws: The extraction of remaining profits paid to the owners based on equity ownership.
- Retained Profit: Cash left inside the company for growth, debt reduction, or strategic reserves.
Mis-benchmarking occurs when a low msp owner salary (W-2) understates necessary labor costs, or when high distributions are incorrectly counted as operational profit margin, overstating company performance.
For consistent operational comparisons, benchmark using the replacement cost of your labor (what you would pay an equivalent CEO/COO). For personal cash planning, focus only on your total after-tax cash (salary + distributions).
Consider two identical MSPs with $300k in true economic profit:
| Scenario | W-2 Salary | Distributions | Retained Profit | True Profit |
|---|---|---|---|---|
| Owner A | $75k | $200k | $25k | $300k |
| Owner B | $250k | $50k | $0 | $300k |
Both owners extracted the same cash, but Owner B’s structure provides a clearer management overhead picture. True company value hinges on repeatable EBITDA, not the owner’s compensation mix.
2. EBITDA: The Only Metric That Governs Valuation and Capacity
Financial stability doesn't equal M&A readiness. Enterprise valuation hinges on a single metric: Earnings Before Interest, Taxes, Depreciation, and Amortization (EBITDA). EBITDA is your pure operational cash engine, isolating profit from financing and tax decisions. Private Equity primarily buys your normalized EBITDA stream, applying a multiple based on recurring revenue quality.
Why Your EBITDA Margin Matters
The benchmark difference is staggering: the median MSP achieves 12% to 15% adjusted EBITDA, while top-quartile firms operate consistently at 20% to 25% or higher. This superior profit margin directly drives a premium valuation multiple.
EBITDA defines your capacity for distributable cash. To find the liquid amount available for owner distributions or reinvestment, subtract mandatory expenditures:
$$ \text{EBITDA} - \text{Debt Service} - \text{Capital Expenditures (Capex)} - \text{Working Capital Needs} = \text{Distributable Cash Flow} $$
Crucially, if you fail to account for the owner's replacement cost as a true labor expense, your reported EBITDA is inflated, rendering subsequent valuation inaccurate. If you do not know your normalized EBITDA margin, your entire long-term plan, including your target msp owner salary and exit goal, is simply guesswork.
3. MSP Owner Compensation Scenarios by Revenue Bracket
The transition between owner compensation models as an MSP scales is a critical source of confusion. To support a clean exit strategy, align your MSP owner salary and distributions to the operational reality of the business size, ensuring your compensation reflects appropriate "replacement cost.
These scenarios are illustrative; actual outcomes rely entirely on your adjusted EBITDA margin, reinvestment needs, and disciplined cash management:
Scenario A: The $1M Owner-Operator MSP
- Owner Role: Primary technician, Head of Sales, and HR.
- Take-Home Source: High W-2 salary-equivalent to compensate for labor, minimal distributions.
- Financial Necessity: Requires 15%+ operational EBITDA and aggressive cash control to buffer payroll volatility.
Scenario B: The $3M Transition Zone MSP
- Owner Role: Fractional CEO/Strategic Sales Lead.
- Take-Home Source: Market-rate W-2 for the CEO role ($150k, $250k+), supplemented by periodic profit distributions.
- Financial Necessity: Requires normalized 20%+ EBITDA to sustain executive payroll and strategic reinvestment.
Scenario C: The $10M+ Delegated MSP
- Owner Role: Visionary/Board Chair, focusing on M&A or high-level GTM strategy.
- Take-Home Source: Structured W-2 mirroring a non-owner CEO, plus consistent quarterly distributions from high retained profit.
- Financial Necessity: Demands 25%+ adjusted EBITDA, with significant retained earnings for M&A readiness.
Do not benchmark based on revenue alone. Gauge your compensation against the scenario that matches the labor role you currently fill inside the business.
4. Policy Models for Owner Compensation & Distributions
After defining replacement cost and target normalized EBITDA, codify a precise policy for calculating the MSP owner salary and profit distributions. Ad hoc distributions create operational noise that PE auditors will reject; the policy must transition to predictability and align incentives with enterprise value creation.
Here are four compensation structures designed for different levels of organizational maturity:
- Market-Based Salary + Profit Distributions: Ideal for stable gross margins and consistent billing.
- Pro: Cleanest separation of W-2 labor cost and equity reward, maximizing M&A readiness.
- Con: Requires high working capital reserves to buffer payroll volatility.
- Modest Base + Quarterly Distributions: Suited for businesses with seasonal revenue or high project variability.
- Pro: Lowers fixed monthly overhead, protecting critical operational cash flow.
- Con: Modest W-2 can distort the owner's true replacement cost for normalization.
- Draw System with True-Up: Used in LLC/Partnership structures requiring fixed monthly owner cash flow.
- Pro: Provides the owner with personal budget predictability.
- Con: Demands rigorous quarterly reconciliation to prevent over-drawing necessary operational reserves.
- Salary + Performance Bonus (KPI-Driven): Aligns owner reward directly with strategic metrics (EBITDA margin, retention).
- Pro: Incentivizes strategic behaviors that rapidly enhance enterprise valuation.
- Con: Complex to structure and requires robust RevOps/tracking infrastructure.
The Discipline Requirement: Never take distributions while underfunding tax liabilities or depleting working capital reserves. This financial indiscipline jeopardizes CapEx targets and signals instability. If structured as an S-Corp, the chosen model must also be IRS-defensible, which is the core compliance requirement governing all founder compensation.
5. IRS Compliance: Documenting Defensible S-Corp Owner Compensation
If your MSP is structured as an S-Corp, your owner salary must be legally defensible. The IRS is unambiguous: compensation for services performed must be reasonable compensation, and non-wage corporate distributions are only acceptable after labor costs are accounted for. Non-compliance risks significant payroll tax back-assessments and severe M&A due diligence friction.
Defining "reasonable" requires documentation across three factors, eliminating speculative pay plans:
- Role: Specific operational duties performed (e.g., Fractional CEO, Technical Lead, Head of Sales).
- Time: Actual hours dedicated to MSP operations.
- Market Comparables: Equivalent compensation for a non-owner executive performing the same role in your region.
To avoid the critical red flag of a very low W-2 with large profit distributions, you must maintain meticulous documentation.
The Reasonable Compensation Documentation Checklist
This checklist acts as your primary defense against an audit:
- Formal job description detailing the owner’s operational responsibilities.
- Evidence of comparable salaries (industry surveys, benchmark data).
- Board/shareholder minutes officially approving the compensation plan.
- Consistent payroll cadence and full payroll tax compliance.
The W-2 salary covers the required labor component; distributions are the tax-advantaged extraction of net profit. Grounding the salary in market data fortifies your tax position and ensures reported EBITDA accurately reflects the true cost of management overhead.
6. Cash Flow vs. Accrual Profitability: Governing Owner Distributions
MSP profitability on paper (accrual basis) often conflicts with cash reality. The P&L recognizes revenue when invoiced, but working capital must cover immediate payroll and upfront costs. Failing to manage this cash timing gap means owner distributions can deplete reserves, hindering operational stability.
The MSP Cash Timing Mismatch
In the managed service model, several specific expenditures create negative cash conversion cycles:
- Upfront Tooling Commitments: Annual or quarterly RMM, security stack, and backup fees create large, immediate cash outflows.
- Payroll Timing Lag: Staff are paid bi-weekly, while client AR cycles often remain net-30 or net-45.
- Hardware and Project WIP: Costs for pass-through hardware or high-labor projects must be fronted long before client payment is collected.
Distributions must follow M&A-ready financial discipline. Implement these three critical guardrails:
- Mandatory Cash Reserve: Maintain 6 to 8 weeks of operational payroll in the bank. This buffer absorbs unexpected AR delays or project spikes.
- Taxes First: Set aside estimated income and payroll tax liabilities before taking any discretionary owner distributions.
- Cash Conversion Cadence: Base distribution frequency (monthly/quarterly) on the true cash cycle. If the P&L was strong but AR collection was slow. You collected only 60% of outstanding receivables, defer the distribution.
Indiscipline, like funding distributions with inadequate cash, signals poor operational control during due diligence, negatively impacting your final valuation.
7. Normalized EBITDA: The Key to Maximizing Your Valuation Multiple
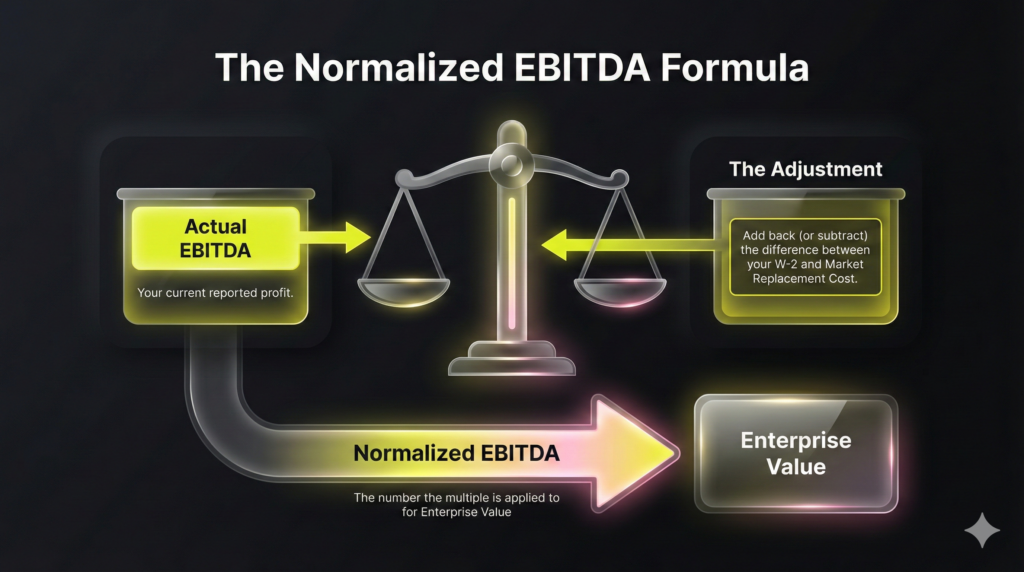
A successful exit depends entirely on the core valuation equation:
$$ \text{Enterprise Value} \approx \text{Normalized EBITDA} \times \text{Multiple} $$
While the multiple is determined by firm size and quality, the accuracy of the EBITDA input is within your control. A higher W-2 MSP owner salary reduces reported EBITDA, but M&A analysts will always normalize this figure during due diligence.
Private Equity firms calculate Normalized EBITDA by performing "add-backs." They adjust for one-time or discretionary expenses to reflect repeatable performance. Crucially, they analyze owner compensation against the true replacement cost of the labor. If an owner accepts a low salary to inflate reported profit, the buyer adds back the difference between that pay and the market rate for a replacement CEO or technical lead. This ensures the valuation reflects scalable management overhead.
This leads to a strategic decision:
- Lifestyle Optimization: Structure compensation for maximum, stable personal take-home distributions now.
- Exit Optimization: Optimize Normalized EBITDA and reduce keyman dependency to maximize future enterprise valuation.
To maintain M&A readiness, track both (1) Actual EBITDA and (2) Normalized EBITDA (with appropriate owner replacement cost) monthly. However, avoid severely starving leadership compensation just to manufacture a higher reported figure; this cripples talent acquisition and management stability, ultimately hurting both growth and the multiple.
8. How Normalization Works: The S-Corp Owner-Comp Add-Back Bridge
A buyer does not accept your books, they rebuild them. Normalization is the diligence step where an analyst strips out how you chose to pay yourself under an S-Corp election and replaces it with what the role would cost an arm's-length owner. Understanding the bridge lets you present the adjusted number yourself instead of watching it get discovered.
The mechanics turn on the S-Corp split most MSP founders already run: a W-2 salary for the labor you perform and distributions on the equity you hold. A buyer cares only about the first bucket, because distributions are a return on ownership, not a cost of running the business. If you pay yourself a low salary to shelter tax and take the rest as distributions, an analyst adds the shortfall back as a cost; if you overpay yourself, they credit the excess. Either way the goal is the same: value the company on a defensible executive replacement cost, not on your personal tax strategy.
These are the categories a diligence team normalizes against your MSP owner salary and the surrounding accounts. Line them up before you go to market:
- Owner replacement cost: Restate salary and benefits to the market rate for a non-owner CEO or technical lead in your role and region, and remove wages paid to non-working family members.
- Distributions reclassified: Move owner draws and dividends out of operating expense entirely, since they are equity returns and not part of repeatable cost-to-serve.
- Discretionary and personal: Strip owner vehicles, personal travel, life insurance, and club memberships run through the business.
- One-time and non-recurring: Add back severance, one-off legal and recruiting spikes, and non-recurring capital purchases that will not repeat under new ownership.
- Related-party terms: Reprice any below-market or above-market rent, loans, or service agreements with entities you also control to true market terms.
Document each adjustment with the evidence behind it: a job description, comparable-role support, board minutes approving the compensation plan, and a consistent payroll cadence. That paper trail is what makes the bridge defensible when a buyer's advisor tests it. For the full diligence context these adjustments feed into, see how to defend your MSP valuation during due diligence, and see how the normalized figure converts to price in the MSP EBITDA multiple valuation guide.
Codifying the Owner Compensation and Distribution Policy
Benchmarking the msp owner salary is meaningless without a repeatable distribution policy. Private Equity diligence requires a documented, non-discretionary methodology for cash movement. Establish transparent guardrails now to transition from an "owner-operator" model to an "M&A ready" structure, linking distributions directly to Normalized EBITDA.
Prerequisites Checklist: Before proceeding, compile the following data points: Last-12-month Revenue, Gross Margin (GM), Normalized EBITDA, Current Cash Balance, Debt Service Schedule, and the owner’s primary operational role/hours (e.g., CEO, Sales Lead, CTO).
Step 1: Define Replacement Cost Compensation
Define the owner’s specific operational duties (e.g., Fractional CEO). Determine the market-rate W-2 equivalent for a non-owner in that role. This W-2 salary is your baseline, non-negotiable labor expense, establishing normalization integrity.
Step 2: Calculate Distributable Cash Pool
Determine the net profit available for equity rewards. Calculate the pool by subtracting four items from Normalized EBITDA: corporate taxes set-aside, required Capital Expenditure (CapEx), scheduled debt service, and required reserve funding. The result is your maximum theoretical distributable cash flow.
Step 3: Implement Distribution Cadence and Guardrails
Transition from ad-hoc draws to a predictable schedule based on your cash conversion cycle.
- Choose Cadence: Select monthly (for stable cash flow) or quarterly (for high volatility).
- Write No-Exceptions Rules: Codify three mandatory guardrails: 1. Maintain a Payroll Reserve Minimum (e.g., 6 weeks operating costs). 2. Complete Full Tax Set-Aside before any distribution. 3. Enforce a Gross Margin Floor (e.g., minimum 20%).
Step 4: Execute Quarterly True-Up and Documentation
Ensure the policy is consistently reviewed and transparent.
- Quarterly True-Up: Reconcile Actual EBITDA and cash against planned performance. Adjust the next period’s distributions based on any variance (over-drawn cash requires immediate repayment or deferral).
- Final Output: Create a concise, one-page policy statement. Share this document with the CFO/Controller to ensure distributions align with operational discipline.