
There is no denying that Facebook is a huge website and social media platform, with billions of users around the world enjoying its services daily. But what are some of the site’s most interesting and eye-opening statistics? This article delves into various statistics about Facebook, providing you with illuminating insights for 2023.
7 Insightful Facebook User Statistics
- Daily Active Users (DAU)
Facebook’s parent company, Meta, published its Quarter 4 of 2022 earnings in February 2023. It reported that Facebook’s DAUs were approximately two billion for December 2022. This presents a 4% increase year over year. Comparatively, Instagram has 500 million DAUs, and Twitter has approximately 260 million.
- Monthly Active Users (MAUs)
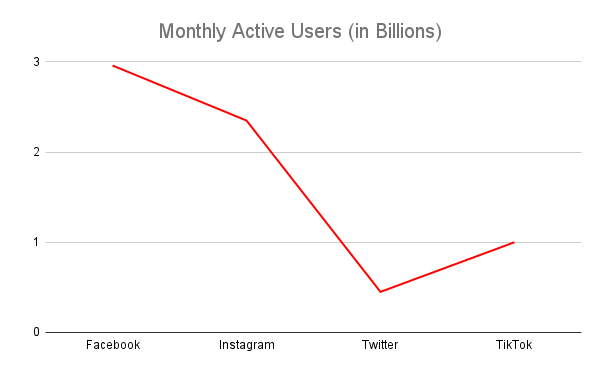
The same report also stated that Facebook’s MAUs were 2.96 billion up to the close of last year, which is a 2% increase year over year. Again, we can see it stacks up well against other social media platforms, with Instagram reporting 2.35 billion MAUs, Twitter with 450 million, and TikTok with one billion.
- Global Users
Facebook is extremely popular in many countries, and over half the population uses the platform. Let’s take a look at a few countries which a high proportion of Facebook users:
- In the US, there were 239 million users on Facebook in 2022, which is roughly 71% of the entire population.
- In December 2022, the UK had more than 52 million Facebook users. This equates to roughly 76% of the total population.
- As of May 2022, there were 179 million Brazilian Facebook users, accounting for almost 82% of the country’s population.
- France had almost 47.5 million users as of February 2022, amounting to over 71% of the population.
- Sign-Ups Per Minute
Facebook receives an average of 400 sign-ups to its platform worldwide every minute. To put this into perspective, about 480 users sign up for TikTok per minute (eight per second), which makes it the fastest-growing social media app.
- Largest Facebook Audience Demographics
As of January 2023, men between the ages of 25 and 34 comprised Facebook’s largest audience (17.6% of worldwide users). The second largest age demographic on Facebook was men aged 18 to 24. TikTok, however, proves more popular with younger female demographics. Its biggest audience is 10-19-year-olds (25% of total users).
- People Using Facebook More Than Once a Day in the UK
Facebook gets used more than once daily by roughly 45% of the UK online demographic.
- Country With the Most Active Facebook Users
The latest data reveals India has the most active Facebook users (almost 315 million). The US, Indonesia, and Brazil also make up the top four countries with the most active Facebook users.
| Facebook User Statistics Summarised | |
| DAUs | 2 Billion |
| MAUs | 2.96 Billion |
| Global Users | US: 239 Million (71%) UK: 52 Million (76%) Brazil: 179 Million (Almost 82%) France: 47.5 Million (Over 71%) |
| Sign-Ups Per Minute | 400 |
| Largest Audience Demographic | Male, 25-34 year-olds |
| UK Population Using Facebook More Than Once Daily | 45% |
| Country With the Most Active Users | India |
3 Useful Facebook Mobile Statistics
- Number of Users Accessing Facebook With a Mobile Device
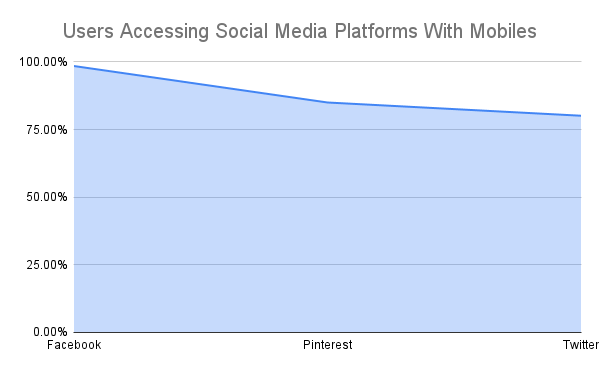
As of January 2022, globally, a sweeping 98.5% of active Facebook user accounts accessed the platform with a type of mobile phone. Conversely, Pinterest data shows that 85% of its users rely on the Pinterest mobile app, and just over 80% of Twitter users access its platform via mobile.
- Time Spent Using Facebook on Mobile Devices
Facebook mobile users are reportedly spending 57 minutes a day on the app, totalling 20,805 minutes per year! Additionally, the network revealed that users now spend a fifth of their time on their smartphones on Facebook. TikTok users, by contrast, spend much longer on the app on average, adding up to an estimated 95 minutes daily.
- Mobile Facebook Ads Revenue
Mobile is the cause of almost 95% of Facebook ads revenue. This illustrates that mobile adverts fuel Facebook’s growth.
| Facebook Mobile Statistics Summarised | |
| Number of Users Accessing Facebook With Mobile Devices | 98.5% |
| Average Time Spent on Facebook Per Day | 57 Minutes |
| Facebook Ads Revenue | Responsible For Almost 95% |
7 Interesting Facebook Advertising Statistics
- Average Cost-Per-Click (CPC)
As of January 2022, the average CPC on Facebook was $0.94. This makes it cheaper than advertising on other platforms such as YouTube, LinkedIn, and Instagram and is, therefore, an appealing advertising option for businesses.
- Facebook’s Potential Advertising Reach
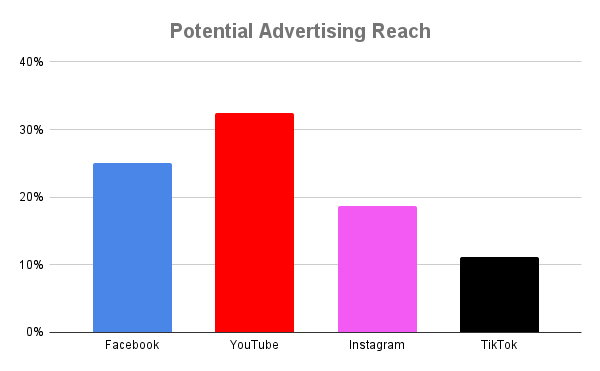
There is great potential for Facebook as an advertising platform — its potential reach is over 2 billion people! This adds up to over 25% of the world’s population. Regarding other platforms, Instagram has a potential ad reach of 18.7%, TikTok has an 11.2% potential reach, and YouTube trumps them all with 32.4%!
- Best Time to Advertise on Facebook
According to current statistics, the best time to post an advert on Facebook is between 8 am to 12 pm on Tuesdays and Thursdays.
- Facebook Advertising Revenues
Recent data revealed that Facebook advertising revenues comprise an overwhelming majority of its overall revenues. In 2022, 97.5% of the $116.6 billion generated originated from adverts.
- Advertising Expenses
In 2022, Meta announced that it had incurred more than $2.6 billion in advertising expenses, illustrating how significant advertising is on the platform.
- Facebook Stories Potential Advertising Audience
Facebook Stories is an increasingly viable option for advertisers, with a potential advertising audience of 1.25 billion users. Meanwhile, the potential ad reach of Instagram Stories is a more modest 996 million.
- Active Advertisers On Facebook
To date, Facebook has over 10 million active advertisers on its platform. Snapchat has over 35 million businesses using its site, and Instagram has two million.
| Facebook Advertising Statistics Summarised | |
| Average CPC | $0.94 |
| Potential Ad Reach | Over 2 Billion (Over 25% of the Total Population) |
| Best Time to Advertise | 8 am to 12 pm on Tuesdays and Thursdays |
| Advertising Revenues | 97.5% of the Total Revenue Generated Came From Ads |
| Advertising Expenses | $2.6 Billion in 2022 |
| Facebook Stories Potential Audience | 1.25 Billion |
| Active Advertisers | Over 10 Million |
7 Illuminating Facebook Video Statistics
- Average Watch Time
The average watch time of Facebook videos is 10 seconds. A Facebook video view is counted when it has been watched for at least three seconds on the platform. Conversely, TikTok typically has a watch time per video view of 3.33 seconds. However, on TikTok, a video view is counted as soon as it starts playing.
- Time Spent Watching Videos
The average user spends 50% of their time on Facebook watching videos. This shows how popular videos are on the platform.
- Percentage of Relevant Video Ads
Data reveals that 71% of consumers find Facebook video adverts either relevant or highly relevant to them. This illustrates that Facebook does a robust job of personalising consumer adverts.
- Square Versus Landscape Videos
Square videos are far more popular on Facebook than landscape, accounting for up to 35% more views. Hence, square videos are the better choice for advertisers looking to reach more Facebook viewers.
- Video Percentage of Facebook Content and Engagement Rate
Facebook videos are responsible for 15.1% of all Facebook content. Additionally, Facebook video posts have an average engagement rate of just over 6%. Facebook videos earn the highest engagement out of any content type on Facebook.
- Daily Video Views
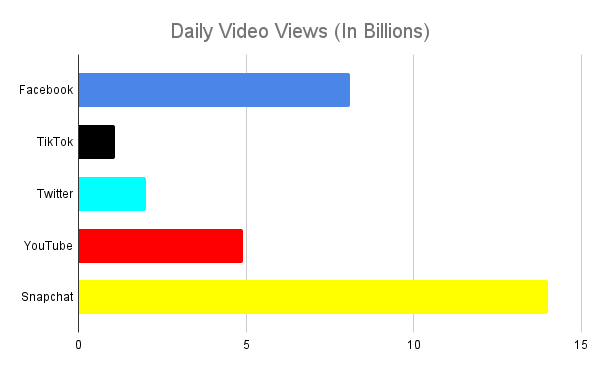
Facebook gains over eight billion video views daily. This is substantially higher than other platforms, with TikTok receiving just over one billion views, Twitter with two billion, and YouTube with almost five billion. Snapchat has the highest number of daily video views, with 14 billion.
- Percentage of Users Playing Videos Without Sound
A whopping 85% of Facebook users play videos without the sound on. This makes it important for advertisers to draw in consumers without relying on audio. It can consequently be a good idea to add subtitles and enhance the visual experience.
| Facebook Video Statistics Summarised | |
| Average Watch Time | 10 Seconds |
| Time Spent Watching Videos | 50% |
| Percentage of Relevant Video Ads | 71% |
| Square Vs Landscape | Square Accounts For Up To 35% More Views |
| Video Percentage of Facebook Content and Video Engagement Rate | 15.1% of Facebook Content is VideoEngagement Rate of Just Over 6% |
| Daily Video Views | Over 8 Billion |
| Videos Played Without Sound | 85% |