TikTok is an increasingly popular social media platform, with billions of downloads to date. But what are some revealing statistics about the site? For instance, what is the most popular content category? Is TikTok more popular with males or females? How long does the average person spend on TikTok per day? Read on to explore fascinating facts about the social media giant.
Fun TikTok Statistics
Brand Value
The brand value of TikTok in 2023 totalled $66 billion. This is an increase from the year before, which had a valuation of $59 billion. As a result, TikTok is one of the most valuable media brands in existence.
Most Downloaded App of 2022
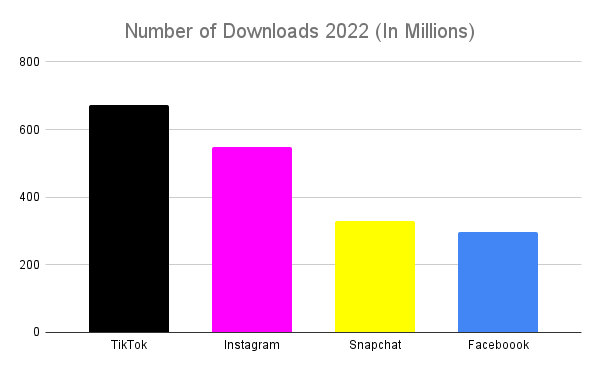
TikTok was officially the most downloaded mobile app globally in 2022, with 672 million downloads! Meanwhile, Instagram was the second most downloaded with 548 million downloads, Snapchat had 330 million, and Facebook had 298 million.
Total Number of Downloads As of 2023, TikTok has been downloaded more than three billion times! TikTok is the first non-Facebook mobile app to reach this impressive number.
TikTok Follower Stats: Most Followed TikTok Accounts
Khaby Lame has the most TikTok followers, with 155 million (as of March 2023). He is best known for mocking life-hack videos. He took the title from Charli D’Amelio in June 2022, who is currently the second most-followed user with 150.1 million. Bella Poarch is third with 92.9 million followers, Addison Rae is fourth with 88.8 million, and Mr Beast is fifth with 77.8 million.
Most Popular Content Categories on TikTok
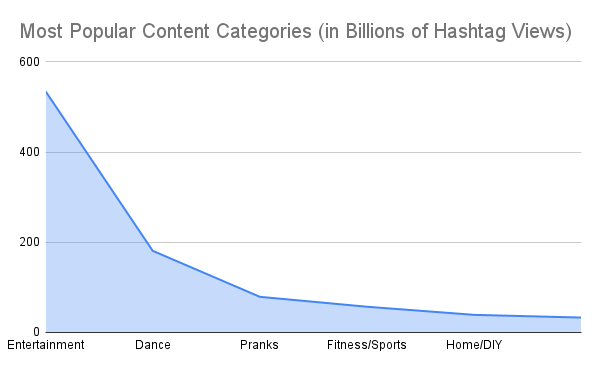
According to hashtag views, Entertainment is the most popular category to date on the TikTok app, with 535 billion views. The second-most popular is Dance, with 181 billion. Other well-performing categories include Pranks (79 billion), Fitness/Sports (57 billion), and Home/DIY (39 billion).
TikTok Daily Video Views
TikTok videos are viewed more than one billion times a day. While this is a huge amount, certain other platforms receive more, with eight billion on Facebook and 14 billion on Snapchat video views daily.
Fun TikTok Statistics Summarised
Brand Value
$66 Billion
2022 Downloads
672 Million
Total Number of Downloads
Over 3 Billion
Most Followed Account
Khaby Lame (155 Million Followers)
Most Popular Content Category
Entertainment
Daily Video Views
Over 1 Billion
TikTok User Demographics
Gender
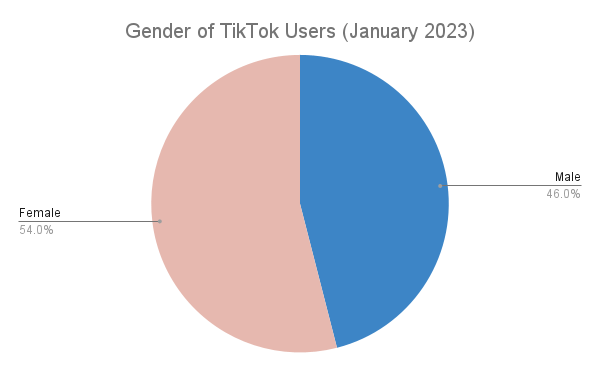
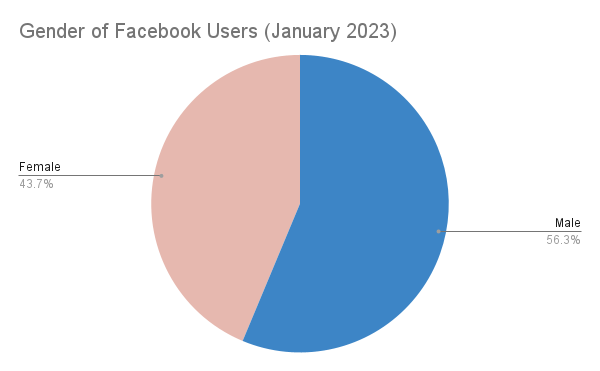
As of January 2023, roughly 54% of all TikTok users were female. Male users, therefore, comprised 46% of the platform’s total users. Interestingly, on Facebook, male users comprised the majority, with 56.3% of the total, and females, 43.7%.
Most Popular Age Group
TikTok has proved more popular with younger generations. Data released in January 2023 revealed that 21.5% of TikTok’s audience worldwide was females between 18 and 24 years old. Male users in the same age range comprised 17% of the total audience. Additionally, females aged between 25 and 34 made up 17% and male users of the same age, 15%.
Country With the Most TikTok Users
China’s version of TikTok — Douyin — has more than 700 million daily active users (DAUs), making it the country with the most platform users. The US has the largest TikTok audience, with 113 million users, then Indonesia, with roughly 110 million, followed by Brazil, with nearly 82 million users.
TikTok User Demographics Summarised
Gender
54% Female
Most Popular Age Group
18-24 Year-Olds
Country With Most Users
China (700 million DAUs)
TikTok Usage Statistics
Most Popular Social Media Platforms
As of 2023, TikTok is the sixth most popular social media platform based on its monthly active users (MAUs). Facebook is the most popular, followed by YouTube, Whatsapp, Instagram, and WeChat.
How Often Users Open TikTok Per Day
The average user opens the TikTok app around 19 times a day! This compares to an average of eight times a day for Facebook users.
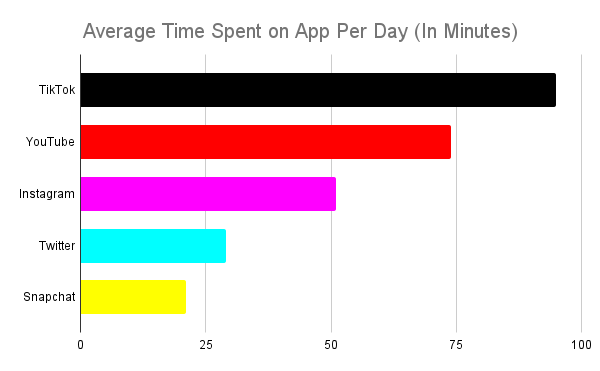
Time Spent on TikTok Per Day
Recent data revealed that TikTok users spend an average of 95 minutes daily on the app. This shows users spend much time enjoying the app, especially compared to some of its competitor platforms. YouTube witnessed the second-highest average time spent on its app with 74 minutes a day, Instagram with 51 minutes, Twitter with 29 minutes, and Snapchat with 21 minutes daily.
How Long Children Spend on TikTok
2021 statistics revealed that children spent a lot of time using TikTok. Globally, children spent approximately 91 minutes a day on TikTok that year, a decided increase from 75 minutes noted in 2020. Additionally, children in the UK spent the most time on the app, with an average of 102 minutes per day recorded in 2021. US children, on the other hand, averaged 99 minutes daily in the same year.
However, more recent data announced that, in 2022, TikTok was used by 4-18-year-olds an average of 107 minutes a day, showing a steady increase over time. YouTube was previously the app children would spend the most time on, although TikTok has held this title since June 2020.
Daily Active Users (DAUs)
TikTok is reported to have more than 600 million DAUs worldwide and one billion MAUs.
TikTok Usage Statistics Summarised
TikTok Popularity
6th Most Popular Social Media Platform
Average No. Of Times App is Opened Daily
19
Average Time Spent on TikTok Daily
95 Minutes
Average Time Children Spend on TikTok Daily
107 Minutes (2022)
DAUs
Over 600 Million
MAUs
Over 1 Billion
TikTok Business Statistics
Increased Advertising Spend
85% of e-commerce brands intend to increase advertising spending on TikTok in 2023. On Meta, 39% of brands plan to increase spending, but interestingly 31% intend to spend less on Meta. This suggests that businesses view TikTok as a worthwhile platform to advertise on in the current year, more so than Facebook.
TikTok Ad Revenue
TikTok’s advertising revenues are due to reach over $18 billion this year (2023). This represents a 55% increase from 2022.
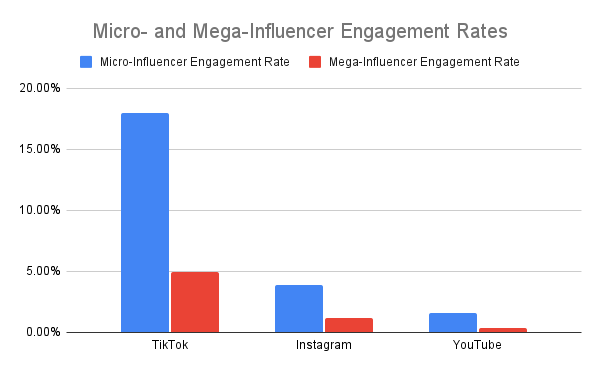
Influencer Engagement Rates
TikTok has impressive influencer engagement rates compared to both Instagram and Youtube. For instance, micro-influencers witnessed engagement rates of 17.96% on TikTok, whereas engagement rates were just 3.86% on Instagram and 1.63% on YouTube. When considering mega-influencers, TikTok saw a 4.96% engagement rate compared to 1.21% on Instagram and just 0.37% on YouTube.
Moreover, recent studies reveal that TikTok is currently the most engaging social media platform, with an average engagement rate of 5.96%.
TikTok Business Statistics Summarised
Percentage of E-Commerce Brands Intending to Increase Ad Spend on TikTok in 2023
85%
Ad Revenue
Forecast to Reach Over $18 Billion in 2023
Influencer Engagement Rates
Micro-Influencers: 17.96%Mega-Influencers: 4.96%
TikTok Marketing Statistics
TopView Adverts
In a recent survey, participants were asked whether they prefer TikTok’s TopView ad format or advertising formats on other platforms. 72% stated that TopView was their preference. Reasons include its sound-on, full-screen options, and organic placement within the TikTok app.
Ad Reach
TikTok ads reach nearly 18% of all internet users 18 years and over. Furthermore, they reach 25% of Female Gen Z users and 17.9% of male Gen Z users.
Communicate Ad Message Instantly
Research has shown that over 60% of successful TikTok adverts deliver their message instantly. This demonstrates the importance of grabbing the viewer’s attention immediately before they scroll past.
TikTok Marketing Statistics Summarised
Percentage of People Who Prefer TikTok’s TopView Ad Format
72%
Ad Reach
Almost 18% of All Internet Users Over 18
Percentage of Successful Adverts That Deliver Instant Message