B2B SaaS analytics refers to collecting and interpreting data to make informed decisions in the context of business-to-business (B2B) software-as-a-service (SaaS) companies. It involves tracking and measuring various metrics and key performance indicators (KPIs) to understand the company's performance. With the right data collection software, businesses can ensure accurate, real-time tracking of these crucial metrics, enabling more effective decision-making.
In this article, we'll explore the role of data in scaling B2B SaaS companies, the key metrics to track, and how to improve B2B SaaS analytics. For more in-depth insights and tailored strategies, consider reaching out to a specialized SaaS consulting agency, which can provide expert guidance tailored to your company's unique needs and goals.
Key Takeaways
- B2B SaaS analytics is the practice of tracking KPIs like CAC, CLTV, churn, MRR, and NPS to make data-driven decisions about product, marketing, and revenue.
- Customer Acquisition Cost is calculated by dividing total marketing spend by new customers acquired: a $10,000 campaign that brings 50 customers gives a CAC of $200.
- Customer Lifetime Value tells you how much you can justifiably spend to acquire a customer, so compare it against CAC to gauge whether your growth is sustainable.
- A rising churn rate is an early warning to diagnose gaps in product, features, or onboarding, and exit surveys from churned customers are some of the most useful feedback you can collect.
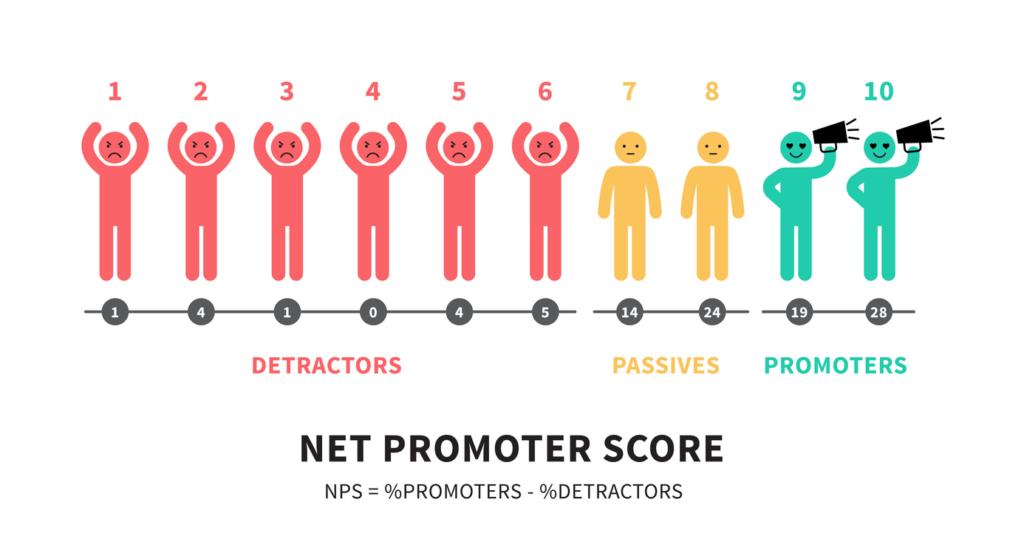
- Net Promoter Score sorts customers into Promoters (9-10), Passives (7-8), and Detractors (0-6), and is calculated by subtracting the percentage of detractors from the percentage of promoters.
The Role of Data in Scaling B2B SaaS Companies
For B2B SaaS ventures, analytics provides an in-depth understanding of customer behaviour, discerns market trends, and anchors your decisions in tangible insights. But it's not only about gathering this information; it's about the refined art of sifting through it and uncovering wisdom. Here's how you can harness data effectively for your business:
1. Refining Product Development
At the heart of any SaaS business lies its product. By meticulously reviewing customer feedback and real-time usage patterns, you can pinpoint precisely where improvements are needed. Perhaps there's a feature users consistently struggle with or an unmet need glaring right at you. Investigating this helps you notice these nuances, ensuring you always elevate user experience and, in turn, loyalty.
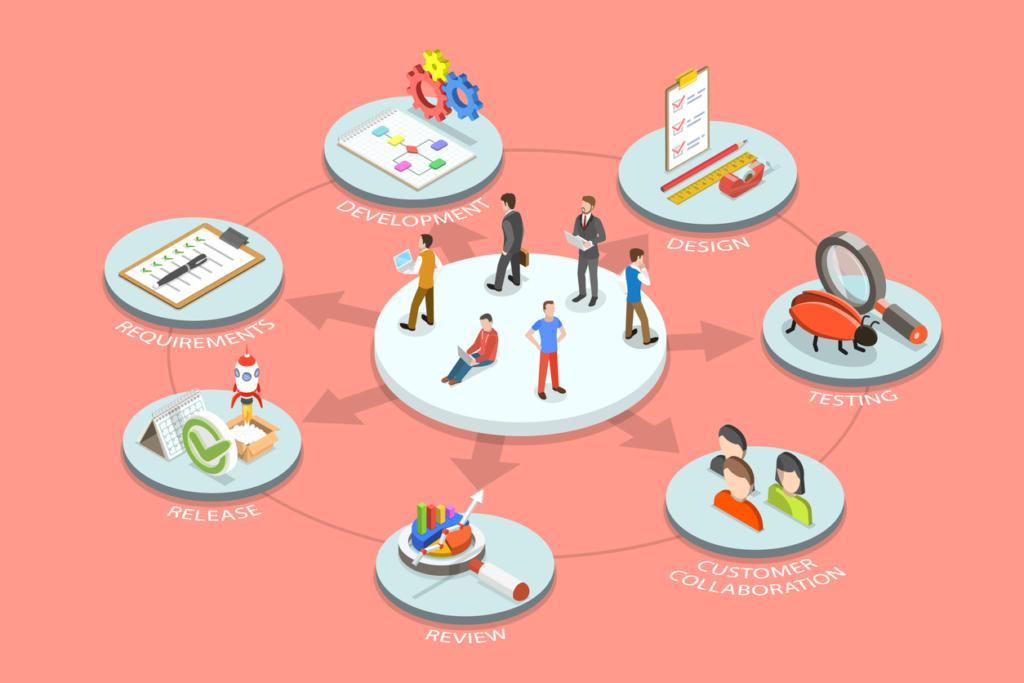
2. Identifying Market Opportunities
The market landscape is ever-changing, with new niches sprouting up almost daily. However, not all opportunities are evident at first glance. With its intrinsic patterns and trends, data can be your treasure map. By diving into patterns and evaluating customers, potential new segments or untapped industries can emerge. Targeting these goldmines can broaden your customer horizons and considerably bolster your revenue streams.
3. Analysing Sales and Revenue
Setting ambitious targets is commendable, but tracking your progress towards them is crucial. Through systematic revenue analysis, you can measure how well you're aligning with your key metrics and KPIs. For instance, maybe there's a quarter where you didn't hit the mark, or perhaps there's an unprecedented spike in sales. Delving into these fluctuations and understanding their root causes empowers you to recalibrate sales strategies and ensure you're always on an upward trajectory.
Key Metrics to Track for B2B SaaS Analytics
There are several metrics essential to the software industry and scaling operations. The following figures provide companies with a clear understanding of their performance and help them make data-driven decisions.
Customer Acquisition Cost (CAC)
This metric measures the cost of acquiring a new customer, and you can calculate it by dividing the total marketing expenses by the number of new customers acquired. Let's put it into context. If you've launched a new online campaign that costs you £10,000 and it brings in 50 new customers, then your CAC is £200.
When you're investigating the performance of your software and marketing efforts, it's pivotal to track this regularly. Why? Because if your CAC starts creeping up, it's a signal that your marketing might become less efficient. Moreover, comparing CAC with Customer Lifetime Value (more on this next) gives you a sense of how sustainable your growth is. If you spend more to acquire a customer than they bring value, it's time for a strategic rethink. Therefore, it's always a good idea to revisit and diversify your channels to see which ones yield better ROI.
Customer Lifetime Value (CLTV)
CLTV measures the total revenue generated by a customer over their lifetime with the company. So, where CAC tells you what you're spending, CLTV illuminates what you stand to gain. Imagine one of your customers, Company A, subscribes to a package that costs £500 per month, and they tend to stay with you for an average of three years. Their average CLTV is £18,000 (minus any servicing costs).
Therefore, continuously assessing the CLTV allows you to determine how much you can justifiably spend on acquiring customers and remaining profitable. Suppose you notice that customers from a particular industry or segment have a significantly higher CLTV; it might be worth tailoring your product or marketing efforts to attract more from that segment.
Consequently, by tracking CLTV, companies can understand their customers' value and identify opportunities to increase revenue through upselling, cross-selling, or retention strategies.
Achieving accurate forecasting is crucial for optimizing ROI. For a detailed guide on this, watch the video "Forecasting Sales Step by Step (Predictive Analytics, LTV, Cohort Analysis)."
Churn Rate
The churn rate, which measures the percentage of users dropping off or discontinuing your service over a specified period, is a barometer of customer satisfaction. In short, this metric is a reality check.
If your churn rate increases, it's an immediate signal to diagnose the problem areas. It may point towards gaps in your service, product features, or overall customer experience. For instance, if the churn rate spikes after a software update, you need to assess what went wrong. Was it a bug? Did you remove or alter a beloved feature? Addressing these pain points can pave the way for enhanced user satisfaction and loyalty.
Additionally, feedback from churned customers is gold. Regular exit interviews or surveys can provide a wealth of information on where you can improve. It's not always about winning new customers; sometimes, it's about keeping the ones you have.
Adoption Rate
How many people go from a free trial to a paying subscriber? How many users are integrating a new software feature? This figure is your adoption rate.
For example, if you have a feature that subscribers barely use, the adoption rate will spotlight it. Say, after introducing a new analytics dashboard, only 10% of your clientele use it. It could mean they don't see its value or find it too complex.
Furthermore, the conversion from 'free to paid' is a significant point in the buyer's journey, and it signifies your ability to convince customers of your product's value. For instance, a high adoption rate is excellent; it tells you that customers understand your product, how to use it, and believe it is worth paying for. However, a low adoption rate is detrimental and an immediate sign to investigate.
If free trial users aren't subscribing to your platform or if a feature isn't being used, you need to consider the following things:
- Does the product or feature meet the customers' needs?
- Do they understand how to use your product or feature?
- Are you responding to their feedback and offering good customer service?
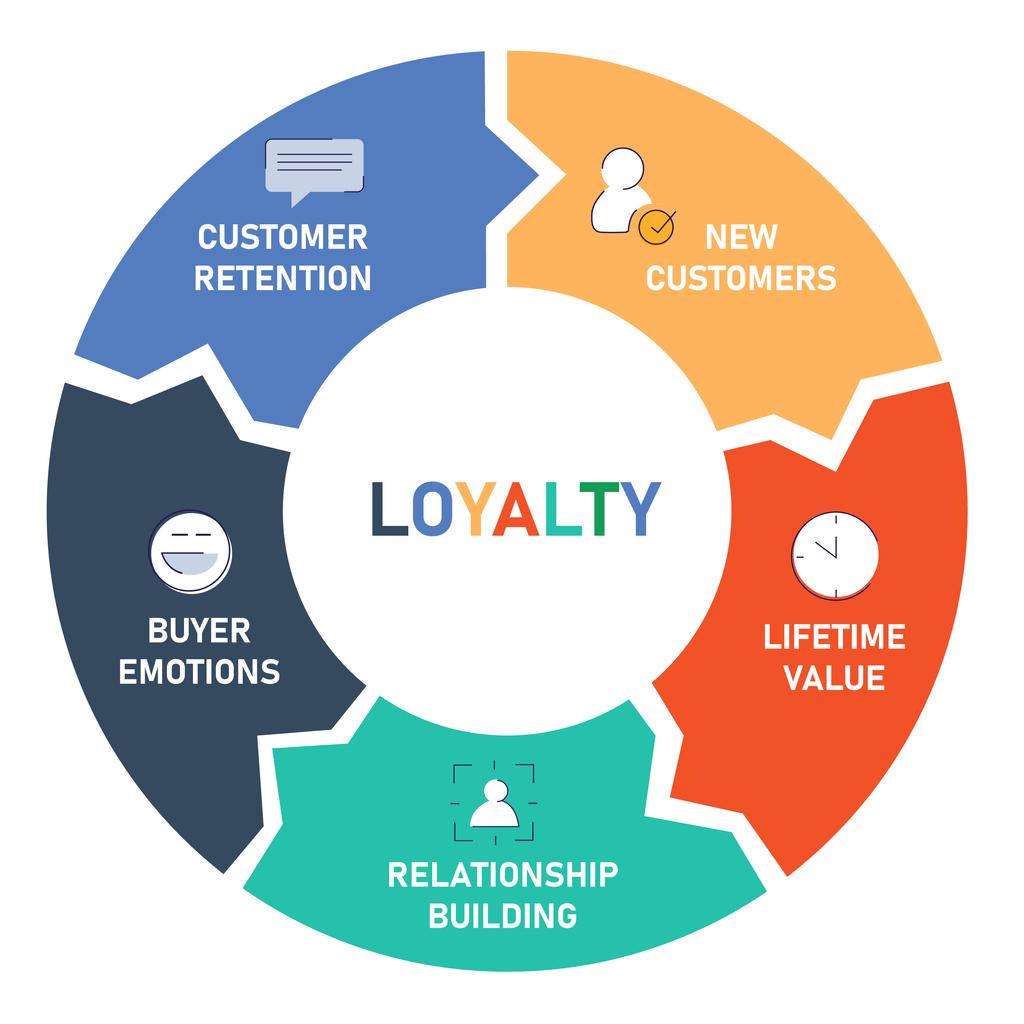
Customer Retention Rate
While similar to churn, retention rate focuses on the positive. If you launched a new customer support initiative and saw your retention rate climb from 85% to 90%, that's a solid indication of the initiative's success.
Remember, it's often less expensive to retain an existing customer than to find a new one. Therefore, engage with your long-term customers. Offer loyalty discounts or early access to new features to make them feel valued and integral to your business.
Net Promoter Score (NPS)
NPS is more than just a number; it's a window into your customers' loyalty. At its core, NPS boils down to one simple question: 'On a scale of 0-10, how likely are you to recommend our product/service to a colleague or business partner?' Based on the responses, you can categorise customers into three groups:
- Promoters (9-10): Loyal enthusiasts who will champion your product and refer others, propelling organic growth.
- Passives (7-8): Satisfied but indifferent clients who could easily sway towards competitors.
- Detractors (0-6): Unhappy customers at risk of churning and potentially damaging your brand through negative word-of-mouth.
The formula for NPS is straightforward: subtract the percentage of detractors from the percentage of promoters.
Consequently, if you notice a sudden surge in detractors, there might indicate deeper systemic issues, perhaps a new update that isn't resonating well or consistent service downtimes. Therefore, if a significant client scores you 6, don't just brush it aside. Reach out, understand their grievances, and rectify them. When you turn a detractor into a promoter, it can be immensely rewarding as it increases brand loyalty and trust.
Conversely, a spike in promoters could indicate that your latest features or customer support enhancements are a hit. You can expect a high score to translate into organic growth via word-of-mouth referrals.
Monthly Recurring Revenue (MRR)
The heart rate monitor of your business. That's MRR. If you introduce a new pricing tier and see your revenue jump, it's clear evidence of its success. On the other hand, if it starts dwindling, you might need to assess if customers are downgrading their packages or if you're experiencing higher churn.
Furthermore, keeping a keen eye on this metric assists in financial planning. Whether considering a new hire, launching a marketing campaign, or expanding to new regions, an upward-trending MRR can give you the confidence to make these decisions.
Sales Qualified Lead (SQL)
Ah, the Sales Qualified Lead, or SQL as it's fondly abbreviated. This isn't just any regular lead; it's the crème de la crème of your sales funnel. Why should you care about SQLs? Because understanding and identifying SQLs can boost your conversion rates dramatically. These are the folks who have passed the initial stages of your funnel and shown genuine interest in what you’re offering. They've done more than just download a free e-book; they’ve actively engaged with your brand, maybe through a consultation, trial or a series of educational webinars.
So, how do you identify an SQL? Well, you'll typically have a set of predetermined criteria to score these leads. This could include behavioural factors like website engagement, or situational criteria like company size and need for your service. You and your sales team would then decide, based on this score, if the lead is ripe for direct sales engagement.
And what can you learn from tracking SQLs? For starters, you'll gain insight into how well your marketing activities convert prospects into actual sales opportunities. It also helps you identify gaps in your sales funnel and gives your sales team a clearer picture of where to focus their efforts. So, in short, keep your eyes peeled for SQLs; they’re the ones who are most likely to end up paying your invoices.
Product Qualified Lead (PQL)
Next on our metrics journey is the Product Qualified Lead (PQL). Think of PQLs as leads who’ve used your product and realised they can’t live without it. These are not just any users; they're users who have experienced that “aha” moment with your product. Now, you might be thinking, "Why focus on PQLs when I already know about SQLs?"
Well, PQLs offer you a different, yet equally valuable, perspective. You see, PQLs have directly interacted with your product, perhaps through a freemium model or trial. Because of this hands-on experience, they have a high potential to become long-term, paying customers.
To spot a PQL, pay attention to in-product analytics. Look for specific actions or behaviours that correlate with long-term use and higher customer lifetime value. This could be something like reaching a certain level in a game, integrating an application with another tool, or using a premium feature within a trial period.
By focusing on PQLs, you can enrich your engagement strategies. This could involve triggering targeted emails or in-app messages based on the actions they’ve taken. For example, if a user in a trial version uses a premium feature, you can send a message encouraging them to fully unlock this feature in the paid version.
Monitoring PQLs can also help you refine your onboarding process, optimise your feature development, and, most importantly, engage prospects at the most opportune moments in their buying journey. So, my friend, PQLs are not just a nice-to-have; they’re a metric you should really pay attention to if you want to supercharge your conversion rates.
Lead Score
Now let’s dive into the realm of lead scoring. If SQLs and PQLs are the crown jewels, then consider lead scoring as the intricately designed jewellery box that holds them. It's a composite score that helps you rank and prioritise leads based on a myriad of factors, such as behaviour, engagement, and demographic information. In essence, it's the formula behind the magic.
But why should you add this extra layer of complexity to your analytics? Because not all leads are created equal. By attributing scores to different leads, you allow your sales and marketing teams to laser-focus their efforts on the most promising prospects.
Implementing lead scoring usually involves setting up specific criteria and assigning different weightages to these criteria. For example, you could attribute 10 points for attending a webinar, 5 points for clicking through a newsletter, and 20 points for a sales inquiry. Once a lead accrues a certain number of points, they may become an SQL or even a PQL, depending on your particular model.
Lead scoring isn't just a numbers game; it's a strategy for resource optimisation. By regularly reviewing and updating your lead scoring model, you can ensure that it aligns with your ever-evolving business goals. So, by understanding the granular behaviour and qualities of your leads, you can more efficiently guide them through the funnel towards a successful conversion.
| Metric | Description | Example / Importance |
| Customer Acquisition Cost (CAC) | Measures the cost of acquiring a new customer. | CAC of £200 if a £10,000 campaign brings 50 new customers. |
| Customer Lifetime Value (CLTV) | Measures the total revenue generated by a customer over their lifetime with the company. | CLTV of £18,000 for a £500 per month subscription over three years. |
| Churn Rate | Measures the percentage of users discontinuing your service over a specified period. | Indicator of customer satisfaction and potential problem areas. |
| Adoption Rate | Measures the percentage of users integrating a new feature or converting from free to paid. | Insights into feature usage and conversion success. |
| Customer Retention Rate | Focuses on the percentage of customers who continue using your service. | Shows positive customer relationships and success of initiatives. |
| Net Promoter Score (NPS) | Measures customer loyalty through the likelihood of recommending the product. Categorised into Promoters, Passives, and Detractors. | Important for understanding brand loyalty and potential growth. |
| Monthly Recurring Revenue (MRR) | The consistent revenue generated from subscribed customers. | Key financial metric for business growth and planning. |
| Sales Qualified Lead (SQL) | A lead deemed ready for direct sales engagement based on predetermined criteria. | Highlights conversion readiness and directs sales efforts effectively. |
| Product Qualified Lead (PQL) | A lead that has interacted with your product and shown high engagement, often through a trial or freemium model. | High potential for conversion; helps fine-tune product development and engagement strategies. |
| Lead Score | A composite score used to rank and prioritise leads based on multiple factors like behaviour, engagement, and demographic information. | Optimises resource allocation by focusing efforts on the most promising leads. |
Leveraging Data Visualisation to Gain Insights
Visualisation is a powerful tool for B2B SaaS companies as it allows them to present data visually in charts, graphs, or dashboards, making it easier to understand and interpret. By organising analytics in this way, companies can quickly and easily identify patterns, trends, and outliers. It helps to simplify complex data sets and communicate findings more effectively. That said, there are several types of visualisation that B2B SaaS companies can use:
- Line charts and bar charts are common for spotting trends and comparisons over time.
- Pie charts and doughnut charts are used to visualise proportions and percentages.
- Heat maps and scatter plots can identify relationships and correlations between variables.
To leverage this effectively, B2B SaaS companies should first consider choosing the right type of chart for the information they want to present. Secondly, they should keep it simple since cluttered or confusing visualisations can hinder understanding and interpretation. Lastly, they should use interactive visuals whenever possible, allowing users to explore the data and gain deeper insights.
How to Improve B2B SaaS Analytics
Improving B2B SaaS analytics involves actionable strategies to enhance your capabilities. Therefore, we have outlined how you can approach some common challenges that B2B SaaS businesses face when reviewing their performance:
1. Revisit Your Onboarding Process
If you're experiencing high churn, consider revisiting your B2B SaaS onboarding process. It might be that the initial set-up experience isn't intuitive or informative enough, and users don't see the value in your product. Therefore, ask yourself if your onboarding set-up effectively educates your users about how to get the most value from your product. Make sure it is user-friendly and teaches new users about key features and benefits. This early engagement is critical for reducing churn down the line.
2. Align Product With Customer Expectations
A mismatch between what the customer expected and what they experienced can impact churn and the CLTV. Consequently, regularly solicit and act on customer feedback to ensure your product meets customer expectations. This might include software updates or adjusting your messaging to align with consumer needs. When you understand and address the pain points of your users, it can lead to more satisfied customers who will recommend your service.
3. Refine Your Pricing Strategy
If your revenue isn't hitting the mark, it might be time to reevaluate your pricing strategy. Are you priced competitively in the market? Are there additional value-added services you could charge for? Alternatively, pricing tiers can make your product more accessible for companies with lower budgets or those hesitant about signing up. A well-structured pricing structure can dramatically impact your bottom line.
4. Bolster Lead Generation Efforts
Another reason for low revenue may be a lack of qualified leads. If you've checked customer feedback and ensured your churn rate isn't too high, you may struggle to attract ready-to-buy customers to your business. If this is the case, consider investing in content creation, SEO, paid advertising, or or SaaS partnership strategies to increase your inbound traffic flow. It's vital to focus your efforts on getting qualified leads, as you don't want to waste your marketing budget on people who aren't interested in your services.
4. Choose the Right Tools
Certain tools can help companies utilise and visualise data. Incorporating these resources into your plan makes your processes more efficient by automating data collection, providing advanced analytics capabilities, and generating interactive visualisations. For example, tools like HockeyStack enable businesses to review their marketing and sales funnel. You’ll be able to easily see which metrics are meeting KPIs and where your processes are underperforming. Moreover, software like DreamData will track your entire SaaS customer journey and help you track how customers interact with your brand. There are numerous B2B SaaS analytics tools out there to try, but make sure they work seamlessly for your goals and platform.
6. Be Proactive, Not Reactive With Your B2B SaaS Analytics
Being reactive instead of proactive in your approach can keep you a step behind in a fast-paced market. Instead, regularly review your data and anticipate trends rather than reacting to them. You could set up alerts for key metrics like churn rate or MRR to help you stay ahead of potential issues.
7. Hire a B2B SaaS Analytics Professional
If it's in your budget, you might hire or train an analyst. These skilled professionals don't just crunch numbers; they bring out meaningful discoveries that can shape your business strategies. With their expertise, you can spot trends, identify growth areas, and make informed decisions to improve business outcomes.
To dive deeper into advanced analytics strategies, listen to the Nuoptima SaaS Podcast featuring Dennis Hu from Drug Hunter.
How Can NUOPTIMA Help?
For evolving B2B SaaS products, analytics are the compass that guides your company towards success, and that's where we at NUOPTIMA come in. As a multifaceted growth agency, we are the beacon for businesses navigating this complex landscape. Specialising in various aspects of digital marketing for SaaS, we offer tailored strategies that align with the unique needs of B2B SaaS companies.
Our services range from B2B SaaS SEO optimisation, designed to elevate your online presence, to expertly crafted LinkedIn and Google Ads campaigns that target high-value leads with precision. Moreover, our SaaS email marketing agency is engineered to convert your audience into loyal customers, while our lead generation services are adept at booking sales calls directly into your calendar, acting as a seamless extension of your sales team.
Although, what truly sets us apart is our deep understanding of the SaaS industry and our commitment to data-driven results. We don't just set up your campaigns; we meticulously build, test, and optimise to ensure that your budget translates into profitable revenue. With NUOPTIMA, you're not just getting a service provider; you're gaining a partner committed to propelling your SaaS business to new heights.
Conclusion: The Future of B2B SaaS Analytics
The future of B2B SaaS analytics is promising. As technology advances, companies will have access to more data and sophisticated tools, enabling them to gain deeper insights. By leveraging this information, companies can identify new opportunities, optimise their products and services, and improve customer satisfaction. A proactive, analytical approach can increase revenue, market share, and profitability.
Book a free call with our software specialists if you need help interpreting and optimising your B2B SaaS promotion efforts. We'll explore the best strategies for scaling your SaaS business.