
You document every client’s environment down to the port, then run your own growth on referrals and local maps feels safe until a major client churns and your pipeline goes flat. These core MSP pain points are not minor annoyances; they are structural growth ceilings capping your pipeline, margins, and valuation. Here are the 8 symptoms of a stalled demand engine, what they cost, and how to self-diagnose. We begin with the most comfortable trap: referral dependence.
Key Takeaways
- Referral dependence is the most common MSP growth ceiling. If the founder stopped networking for 60 days and pipeline dropped, you have no engineered demand.
- AI search visibility is now binary: either you appear when a buyer queries your niche in ChatGPT or Perplexity, or you do not. Absent entity signals and proof assets mean invisible.
- Vendor sprawl is a direct margin tax: every redundant portal adds license cost and technician context-switching time that destroys delivery capacity.
- Feature-led proposals cause prospects to default to price. Repackage services around business outcomes (uptime guarantees, data-restore times, security posture cadence) to protect margins.
- Leaky-bucket retention kills growth: if you cannot name each top-20 client's top three business risks and when you last reported progress on them, quiet churn is already underway.
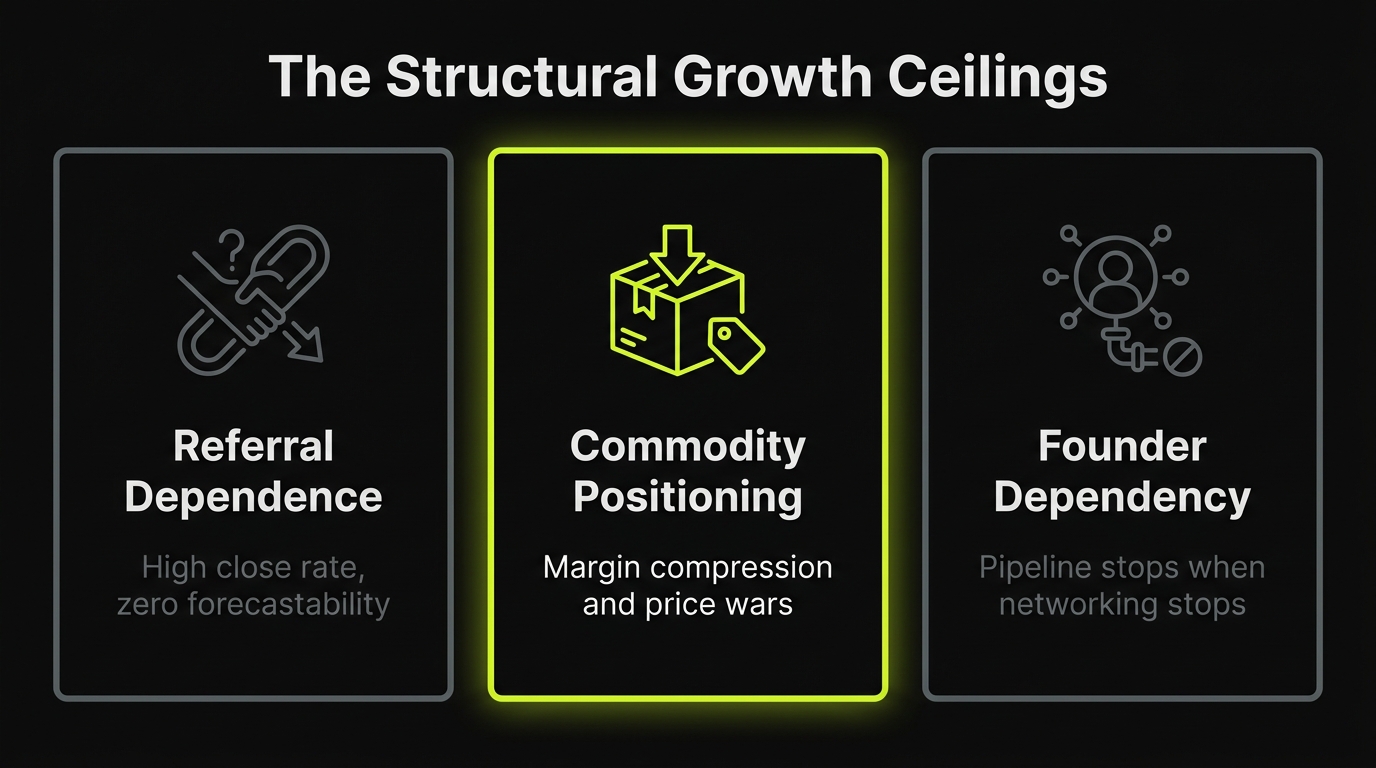
MSP pain points are structural growth ceilings. Referral dependence, AI invisibility, vendor sprawl, feature-led pitches, and retention gaps. That cap pipeline, compress margins, and lower valuation even when delivery is strong.
1. Referral Dependence: High Close Rates but Zero Forecastability
Referrals are trusted but ungoverned, creating boardroom risk and founder dependency. When growth relies on relationships, your best quarters follow a random conference, a client moving, or sheer luck. When a flat quarter hits, you have no leading indicators.
To audit this risk, run a quick self-test: if the founder stopped networking for 60 days, does the pipeline stay above target?
For most owner-led MSPs, the answer is no. This dependency causes lumpy revenue, reactive hiring, difficult capacity planning, and a weaker valuation story because buyers cannot underwrite an unpredictable pipeline.
Your next step is to define a minimum inbound baseline target of qualified meetings per month. Build a predictable demand engine that sits underneath referrals, ensuring your pipeline stays healthy even when the phone stops ringing.
2. The Find-Ability Gap: Invisible on AI and Search Shortlists
This is one of the most critical visibility gaps: you only win deals when a warm introduction paves the way, while competitors with weaker delivery look more visible online. Showing up in Google Maps is no longer enough. When buyers use AI to build shortlists, you face a binary visibility problem: either you appear in the answers or you do not.
Run a quick self-test. Submit 10 specific queries (your city combined with your target niche) into Google, ChatGPT, and Perplexity, and record which MSPs get cited.
If you are absent, you must build clear entity signals and structured proof assets so machines trust and cite you. Track your shortlist visibility score based on three metrics:
- How often you are named.
- How accurately your capabilities are described.
- What verifiable proof is referenced.
3. Vendor Sprawl: The Margin and Cognitive-Load Tax on Your Team
Vendor sprawl is not a tooling preference. It is a direct tax on your operating margin that drives labor leakage and operational drag. Every new platform adds portals, alert noise, and billing contracts, stalling decisions because every vendor claims to be the single source of truth. To diagnose this issue, run a quick self-test: count the security and operations tools your average technician must access weekly.
To reclaim lost margin, run a consolidation scorecard that evaluates every tool across your stack on:
- Feature overlap
- Integration depth
- Alert quality
- Vendor support
This analysis reveals your true total cost of ownership. Quantify the drag by tracking two core metrics: redundant license spend and the exact hours lost weekly to context switching and vendor management.
4. Marketing as Vibes: The Lack of Operational Discipline in Your Demand Generation
The discipline you bring to managed IT rarely exists in your marketing. Without operational standards, your demand generation looks like a collection of vibes:
- Sporadic social posts
- A stalled blog
- Inconsistent outbound campaigns
- A website that fails to answer buyer questions
To audit this gap, run a quick self-test: "Can anyone besides the founder explain why you win in one sentence?"
If not, stop treating marketing as a creative whim. Build an owner-operable demand system that survives busy weeks and reduces founder dependency. Your minimum viable stack requires:
- One niche page
- One comparison page
- Two proof assets
- One local authority page
Measure success strictly on meetings and qualified pipeline, not vanity impressions.
5. The Feature-Led Pitch: Why Proposals Stall on Price and Drift to Cheap Competitors
When proposals focus on technical features, prospects default to cost. They call your bid "too expensive" and sign with a cheaper competitor. This is a positioning failure that causes deals to drift and cycles to drag. Underneath it sits a ceiling most MSP listicles skip entirely: margin compression and price commoditization. If your gross margin has been shrinking even as revenue grows, you are experiencing this ceiling directly, and no amount of referrals or delivery improvement will fix it without repositioning your offer.
Prospects do not buy tickets or toolstacks. They buy risk reduction and business continuity.
The Proposal Self-Test
Review your last five proposals. Count how many times you mention vendor names versus business outcomes.
The Outcome-Led Fix
Repackage your services into outcome-led offers. Tie agreements to these KPIs:
- Guaranteed uptime
- Data restore recovery times
- Security posture cadence
Measure the success of this transition by tracking your win rate by segment and average gross margin by package.
6. The Special-Case Trap: How Custom Delivery Stalls Onboarding and Restricts Growth Capacity
Treating every new client as a special case is one of the costliest delivery traps. It drags onboarding weeks past your estimates and forces senior engineers to resolve basic issues using tribal knowledge. This operational drag masquerades as high-touch customer service, but it actually caps your capacity to scale without adding expensive headcount.
The Escalation Self-Test
List your top 10 recurring escalations from the past month. Identify how many trace back to documentation gaps or standardization failures.
The Standardization Fix
Define strict service catalog boundaries and standard baselines. Treat onboarding as an engineering project with a single owner to create immediate delivery capacity.
Track your operational maturity with these three metrics:
- Onboarding cycle time
- First-90-day ticket volume
- Percentage of clients on your standard stack
7. Operational Burnout: The "Hero Work" Trap That Drives Talent and Client Churn
Engineers waking up at 2:00 AM to chase false alarms is a primary driver of operational burnout. It degrades service delivery, drives talent turnover, and increases client churn. Alert fatigue is not just an HR issue; it is a delivery bottleneck that caps your valuation.
The Noise Self-Test
Calculate your daily alerts per endpoint. Measure what percentage actually requires engineering action versus how many are false positives. If the ratio is skewed, your team is drowning in tool noise.
The Noise Cure
Consolidate your tool stack to eliminate redundant telemetry and establish a clean baseline. Once standardized, automate low-risk ticket responses to shield your staff from alert fatigue.
Track these three recovery metrics:
- After-hours hours per month
- False-positive rates
- SLA breach rates
8. Leaky-Bucket Retention: When Quiet "Whales" Churn Without Warning
New client acquisition is useless if your largest accounts quietly churn because your strategic value is invisible. Churn feels like bad luck until a key client suddenly gives thirty days' notice. This occurs because inconsistent reviews and a missing technical roadmap reduce your service to an interchangeable utility. This is one of the most expensive retention failures.
The Retention Self-Test
For each of your top 20 accounts, name their top three business risks and the exact date you last reported progress on mitigating them.
The Proof Cadence Fix
To protect this revenue, install a structured proof cadence. Replace ad-hoc chats with:
- Quarterly risk reviews
- High-level KPI reporting
- One-page executive summaries
Measure performance using three metrics:
- Net revenue retention
- Churn by segment
- Expansion revenue rate
Two External MSP Challenges the Ceilings Above Sit On Top Of
The eight ceilings above are inside your control; these two MSP challenges come from the market and set the floor everything else stands on. Talent supply and the threat landscape shape your delivery capacity and your risk exposure whether or not you address them, so a growth plan that ignores them is built on sand. Diagnose both before you scale demand.
The Talent Shortage: You Cannot Hire Your Way Out
Skilled engineers are scarce and expensive, and every MSP in your region is bidding for the same people. Relying on senior hires to absorb ticket volume means growth stalls the moment you cannot fill a seat, and burnout, covered in Section 7, accelerates the churn that reopens the gap. Run a quick self-test: what share of your tickets genuinely need a senior engineer versus a documented runbook a tier-one tech could follow?
The fix is structural, not another job posting. Standardize delivery so routine work leaves senior queues, and buy capacity where the math beats hiring. A outsourced help desk for overflow tickets or a co-managed model lets you scale delivery without carrying every salary. Track tickets per engineer and the share of work on your standard stack to prove the lever is working.
Cybersecurity: The Threat You Are Also Selling Against
Attackers now target MSPs directly, because one compromised provider is a doorway into every client behind it. That makes security a delivery obligation and a liability, not just a service line. By 2026, clients and their insurers expect documented controls before they sign, and a single incident can end a contract and dent your valuation. Run a quick self-test: could you produce your patch status, backup recovery evidence, and incident history for your full client base this week?
Close the gap by treating your own posture with the discipline you sell. Enforce a consistent patch cadence with our MSP patch management playbook, standardize backups and MFA across every tenant, and keep a living incident log. Track patch age, mean time to remediate, and the percentage of clients on your baseline controls.
How to Build a Predictable MSP Demand Engine: A 12-Week Execution Schedule
Turn your operational bottlenecks and growth gaps into a controlled, 12-week experiment.
Week 1: Build a One-Page Scorecard
Establish baseline metrics to locate where your pipeline leaks.
- Pipeline: Track the percentage of qualified meetings not sourced by referrals.
- Delivery: Log your exact onboarding cycle time and after-hours engineering hours per month.
- Margin leakage: Audit active tool count, redundant software spend, and technician context-switching time.
Weeks 2 to 3: Run a Shortlist Visibility Test
Audit how search engines and generative AI models perceive your technical authority.
- Query Google and two primary AI tools using 10 specific buyer searches.
- Record which competing providers appear and what specific proof points those platforms cite.
Weeks 4 to 6: Solve Your Primary Constraint
Avoid trying to fix everything at once. Score each ceiling 1 to 5 on two axes: how much it costs you now and how blocked your growth is because of it. Multiply the scores. Fix the ceiling with the highest combined score first. That is your actual bottleneck, not whichever pain feels most urgent.
- If pipeline is the constraint, ship three proof assets and two niche vertical pages to capture existing search volume before scaling paid spend.
Weeks 7 to 12: Run a Neutral Teardown
Review your results. Run a free pipeline diagnostic at nuoptima.com to identify your primary growth bottleneck.